

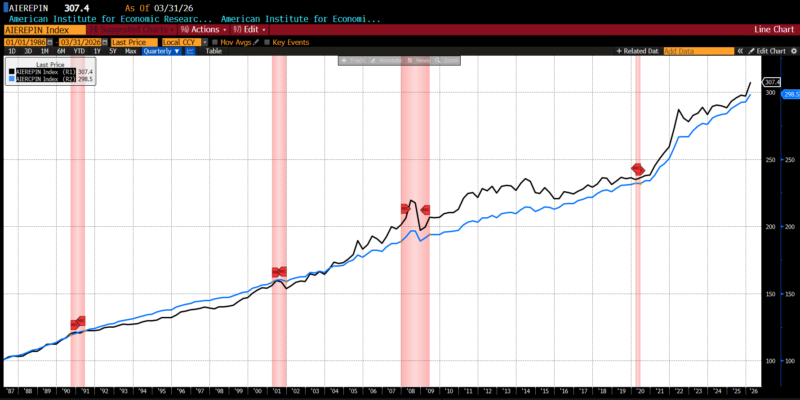
AIER’s proprietary Everyday Price Index (EPI) vaulted 2.5 percent to 307.4 in March 2026, its second-largest monthly increase back to January 2020 (the first was an increase of 2.9 percent in March 2022). Of the 24 price categories that compose the EPI, fourteen rose, two were unchanged, and eight declined. Unsurprisingly, the largest jumps in price occurred in motor fuel, housing fuels and utilities, and food away from home. Prescription drugs, internet services, and food at home declined the most. (The juxtaposition of price changes in the food away from home versus food at home categories likely reflects the gasoline pass-through of food delivery service costs.)
AIER Everyday Price Index vs. US Consumer Price Index (NSA, 1987 = 100)
The US Bureau of Labor Statistics (BLS) released Consumer Price Index (CPI) data for March 2026 on April 10, 2026. Headline inflation rose 0.9 percent over the past month, meeting survey expectations. Core inflation rose 0.2 percent, also meeting forecasts.
March 2026 US CPI headline and core month-over-month (2016 – present)

Consumer prices in March showed a mixed pattern, with food prices flat overall after February’s 0.4 percent gain, as grocery prices slipped 0.2 percent even while restaurant prices continued to edge higher. Within food at home, most major categories softened, led by a 0.6 percent decline in meats, poultry, fish, and eggs — helped by a 3.4 percent drop in egg prices — while cereals, dairy, and nonalcoholic beverages also moved lower; the main exception was fruits and vegetables, which rose 1.0 percent. The dominant story, however, was energy, which surged 10.9 percent on the month, its sharpest increase since 2005, driven by a record 21.2 percent jump in gasoline prices and a 30.7 percent spike in fuel oil, though natural gas prices bucked the trend with a slight decline.
Core inflation, excluding food and energy, remained comparatively subdued at 0.2 percent, matching February’s pace and suggesting that the broader inflation impulse outside commodities remained largely contained. Housing-related costs continued their steady upward march, with shelter and owners’ equivalent rent each rising 0.3 percent, while rent itself increased 0.2 percent. Several travel- and consumer-sensitive categories also advanced, including airline fares, up 2.7 percent, apparel, up 1.0 percent, and education, up 0.3 percent, indicating persistent service-sector firmness. Offsetting those gains were declines in medical care, especially prescription drugs, along with lower prices for used vehicles and personal care goods. Taken together, the March report points to an inflation profile dominated by a commodity-driven energy shock layered atop still-firm but relatively moderate core and shelter pressures.
On the year-over-year side, the March 2026 headline CPI jumped to 3.3 percent from 2.4 percent the prior month, slightly less than the 3.4 percent predicted. Core prices, which strip out the more volatile food and energy components, advanced 2.6 percent over the same period versus the 2.7 percent survey expectation.
March 2026 US CPI headline and core year-over-year (2016 – present)

From March 2025 through March 2026, inflation remained broad but uneven across major consumer categories. Grocery prices rose 1.9 percent overall and restaurant prices climbed a stronger 3.8 percent. Within food at home, the largest annual gains came from nonalcoholic beverages, up 4.7 percent, fruits and vegetables, up 4.0 percent, and the “other food at home” category, which increased 2.9 percent, while cereals and bakery products posted a more modest 2.1 percent rise. Offsetting those gains were declines in dairy products, down 1.6 percent, and in meats, poultry, fish, and eggs, which slipped 0.9 percent from a year earlier. Energy remained one of the strongest inflation drivers, advancing 12.5 percent year over year, led by an 18.9 percent jump in gasoline prices, alongside notable increases in electricity and natural gas costs.
Excluding food and energy, core consumer prices rose 2.6 percent over the year, indicating that underlying inflation pressures remained present but far less dramatic than in the commodity-sensitive categories. Shelter costs continued to provide a steady source of upward pressure, increasing 3.0 percent over the past year and reinforcing the persistence of services-related inflation. Other areas showing meaningful annual gains included medical care, household furnishings, recreation, and especially airline fares, which surged 14.9 percent. Taken together, the annual data suggest an inflation environment shaped by still-elevated energy costs, firm service-sector pricing, and selective food price strength, even as some grocery categories offered consumers modest relief.
The March CPI report was, above all, the first clear inflation print to show the economic effects of the Iran war filtering directly into household prices. The most immediate transmission channel was energy, where the jump in oil prices rapidly fed into gasoline and related fuel costs, pushing the headline reading markedly higher and dominating the public perception of the report. This was less a story of generalized demand pressure than of a geopolitical commodity shock suddenly colliding with the consumer economy. In that sense, March’s inflation picture looked more like an external supply disturbance than the kind of broad-based overheating that typically worries central banks most.
Beneath that headline surge, however, the underlying inflation structure remained comparatively calm. Grocery prices were mixed to softer, several major goods categories showed little evidence of renewed pricing pressure, and some discretionary consumer areas even appeared to weaken as households began adjusting to higher costs at the pump. Services inflation, while still firm in key shelter-related components, generally moderated, suggesting that the oil shock had not yet meaningfully spread into the wider service economy. The only obvious early spillover was in travel-sensitive categories such as airfares, where higher jet-fuel costs likely began feeding through almost immediately.
Taken together, the report reads as the opening stage of an energy-led inflation episode rather than a true reacceleration of the broader price trend. The phenomenology is important: consumers are first encountering the shock in the most visible and psychologically powerful places — gas stations, travel, and transportation-linked expenses — while the rest of the basket remains relativelys stable. That distinction matters where policy is concerned, as it gives the Federal Reserve room to interpret the move as a temporary oil-driven disruption rather than evidence that inflation is becoming entrenched again. The next few reports will determine whether this remains a contained geopolitical price shock or evolves into something more diffuse across an already-strained household cost landscape.