

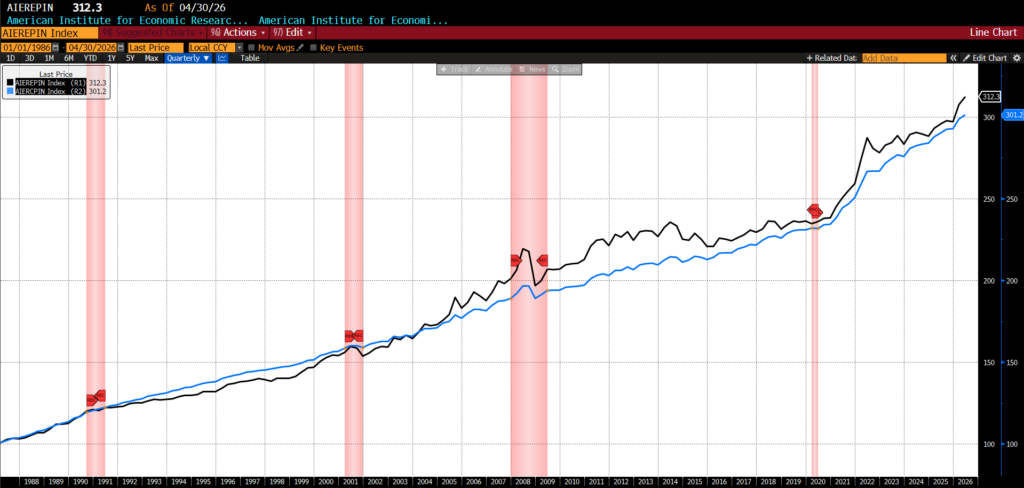
AIER’s proprietary Everyday Price Index (EPI) surged 1.6 percent to 312.3 in April 2026. Among the index’s twenty-four constituents, the prices of thirteen rose, nine declined, and two were unchanged. The largest increases were seen in motor fuel, postage and delivery services, and subscription and rental of video, while the largest declines occurred in recreational reading materials, internet services, and electronic information providers, and nonprescription drugs.
The recent surge in the EPI is historically significant. After rising 2.5 percent in March 2026 and another 1.6 percent this month, the index has posted a compounded two-month increase of roughly 4.1 percent: the fifth-largest back-to-back monthly advance in the entire history of the series dating back to 1987. Only four periods exceeded it: June 2008 (4.8 percent), September 2005 (4.6 percent), June 2022 (4.6 percent), and March 2022 (4.3 percent). The March 2026 monthly increase alone ranks as the third-largest single-month gain on record, trailing only September 2005 (3.3 percent) and March 2022 (3.0 percent).
Historically, the largest spikes in the EPI have tended to cluster around major energy disruptions, geopolitical shocks, or periods of acute inflationary pressure, making the current episode highly consistent with prior periods of commodity and macroeconomic stress. Of particular note, three of the five largest two-month increases in the index’s nearly 40-year history have now occurred since 2022, underscoring the unusually volatile and inflationary character of the post-pandemic economic environment. More broadly, the recent behavior of the AIER Everyday Price Index highlights the persistence of the modern affordability crisis, as the prices of essential, frequently purchased goods and services continue to rise far faster and more erratically than many households’ incomes.
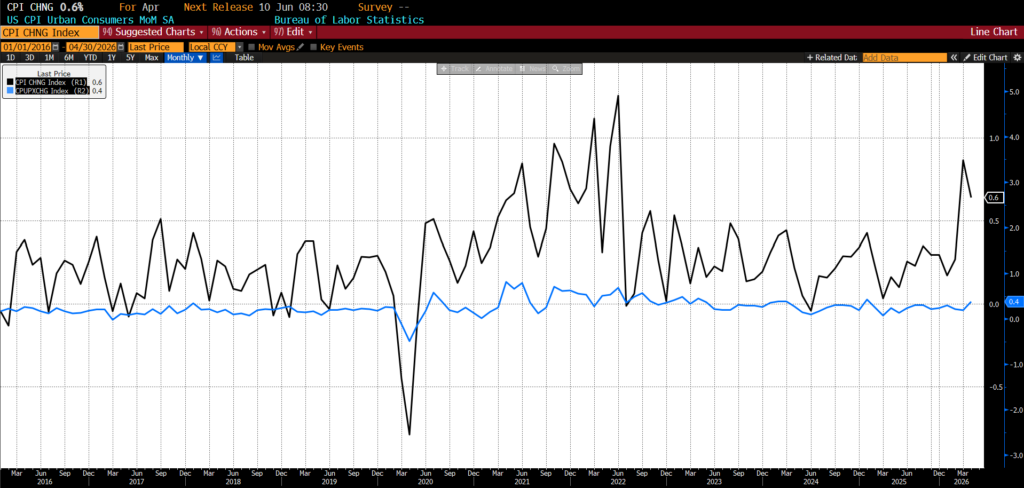
The US Bureau of Labor Statistics (BLS) released April 2026 Consumer Price Index (CPI) data on May 12, 2026. Headline CPI increased 0.6 percent month-over-month, in line with consensus expectations, while core CPI rose 0.4 percent, 0.1 percent higher than surveys anticipated.
AIER Everyday Price Index vs. US Consumer Price Index (NSA, 1987 = 100)
Consumer prices accelerated further in April, with energy and shelter once again driving much of the monthly increase. Food prices rose 0.5 percent after being unchanged in March, led by a 0.7 percent increase in grocery prices as most major food-at-home categories advanced. Beef prices jumped 2.7 percent, helping push the broader meats, poultry, fish, and eggs category up 1.3 percent, while fruits and vegetables climbed 1.8 percent and nonalcoholic beverages rose 1.1 percent. Dairy prices increased 0.8 percent and cereals and bakery products edged up 0.1 percent, though the index for other food at home declined 0.4 percent. Restaurant inflation remained comparatively moderate, with food away from home rising 0.2 percent as limited-service meals increased 0.4 percent and full-service meals advanced 0.1 percent. Energy prices continued to exert outsized influence on the broader index, rising 3.8 percent in April following March’s 10.9 percent surge. Gasoline prices climbed another 5.4 percent on the month, while electricity prices rose 2.1 percent and fuel oil increased 5.8 percent; natural gas was the lone major energy component to decline slightly. On a year-over-year basis, energy prices were up 17.9 percent, including a 28.4 percent increase in gasoline.
Core inflation, excluding food and energy, firmed to 0.4 percent in April after two consecutive 0.2 percent readings, reflecting renewed pressure across several service and consumer-related categories. Shelter costs rose 0.6 percent, with both rent and owners’ equivalent rent increasing 0.5 percent, while lodging away from home advanced 2.4 percent. Household furnishings and operations rose 0.7 percent, airline fares increased 2.8 percent, and both apparel and personal care prices posted solid gains, suggesting continued firmness in discretionary and travel-related spending categories. Education prices also edged higher, while recreation and motor vehicle insurance each rose modestly. Offsetting some of those gains were declines in communication prices, new vehicles, and medical care services, particularly hospital services, while used vehicle prices were unchanged. Overall, the April report reflected an inflation environment increasingly shaped by persistent shelter costs and elevated energy prices, layered atop still-firm service-sector and consumer-category inflation pressures.
April 2026 US CPI headline and core month-over-month (2016 – present)
Over the twelve months ending in April 2026, consumer inflation accelerated materially, with headline CPI rising 3.8 percent year-over-year compared with 3.3 percent in the prior report; forecasts called for a 3.7 percent increase. Over the same twelve-month period, core CPI, which excludes the more volatile food and energy categories, advanced 2.8 percent, modestly above the 2.7 percent pace anticipated.
April 2026 US CPI headline and core year-over-year (2016 – present)
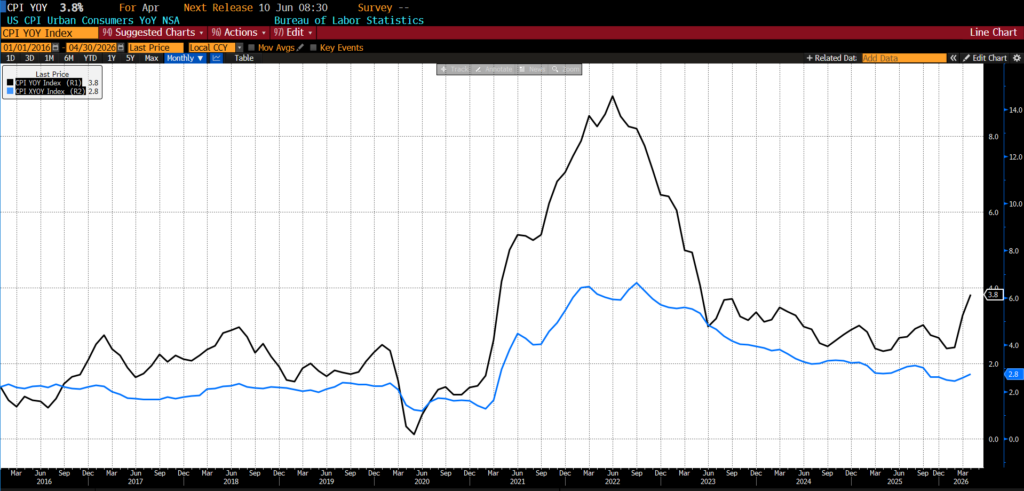
Over the twelve months ending in April 2026, food inflation continued to run unevenly across household categories, with consumers facing especially strong increases in produce, beverages, and dining costs. Prices for food consumed at home rose 2.9 percent from a year earlier, paced by a 6.1 percent increase in fruits and vegetables and a 5.1 percent rise in nonalcoholic beverages. Cereals and bakery products advanced 2.6 percent over the year, while the broader “other food at home” category climbed 2.5 percent. Meat, poultry, fish, and egg prices increased a comparatively modest 1.5 percent, and dairy products were one of the few categories to move lower, declining 0.6 percent on a year-over-year basis. Dining out remained notably more expensive as well, with restaurant prices rising 3.6 percent overall, including gains of 3.8 percent for full-service meals and 3.2 percent for limited-service establishments. Meanwhile, energy inflation remained exceptionally strong. Energy prices overall surged 17.9 percent during the year, reflecting a steep 28.4 percent increase in gasoline prices alongside continued gains in electricity and natural gas costs.
Underlying inflation pressures outside food and energy also remained firmly embedded throughout the broader economy. Core CPI rose 2.8 percent over the year ending in April, with shelter costs continuing to exert persistent upward pressure after advancing 3.3 percent from year-earlier levels. Inflation remained elevated across a number of household and service-oriented categories, including household furnishings and operations, which rose 3.9 percent, and medical care, which increased 2.5 percent. Recreation prices also continued to trend higher. The sharpest annual increase outside energy came from airline fares, which soared 20.7 percent compared with April 2025, underscoring the extent to which travel-related services remained exposed to higher fuel costs and broader pricing pressures. Altogether, the annual inflation picture remained one of broad-based but highly uneven cost increases, with energy, travel, shelter, and several staple consumer categories continuing to place pressure on household budgets.
The April 2026 CPI report reinforced the view that inflation pressures in the US economy are broadening again, driven initially by energy costs but increasingly filtering into services and household essentials. Although the monthly core reading exceeded expectations only marginally, the composition of the report was more troubling than the headline miss itself. Service prices rose 0.6 percent in April, owners’ equivalent rent climbed 0.5 percent, and “supercore” services inflation — a closely watched measure excluding housing and energy — registered 0.45 percent, a level inconsistent with what most policymakers would consider stable inflation. Markets initially reacted calmly, but the underlying details suggested inflation pressures may be becoming more deeply embedded.
Much of the renewed inflation pressure traces back to the energy shock triggered by the Iran conflict and resulting disruptions to oil and refined fuel markets. Gasoline prices rose another 5 percent in April after surging more than 21 percent in March, while airline fares increased 2.8 percent as carriers passed higher jet fuel costs on to consumers through ticket prices, baggage fees, and reduced capacity. The worry is that what began as an energy-driven inflation spike could evolve into a broader “second-round” inflation process — one in which higher fuel and transportation costs gradually work their way through supply chains and into the prices of goods and services throughout the economy. The 0.7 percent increase in grocery prices in April was the largest in nearly four years as meats, dairy products, fruits, and vegetables all posted notable gains, and rising fertilizer costs, shipping disruptions, and refinery shortages are threatening to keep food inflation elevated even if oil prices stabilize somewhat in coming months.
Some portions of the report, however, were distorted by technical factors rather than purely organic inflation pressure. Shelter costs rose 0.6 percent in April, the largest increase in more than two years, partly because the Bureau of Labor Statistics was forced to reconstruct portions of its rent data following the 2025 government shutdown. Because certain rental units were not surveyed during the shutdown, April’s readings effectively capture a full year of rent increases rather than the normal six-month interval, likely exaggerating monthly shelter inflation. Excluding this statistical quirk, core inflation likely would have appeared somewhat softer. Core goods prices were broadly flat, helped by declining new vehicle prices and subdued readings in some tariff-sensitive categories such as apparel and toys. Nevertheless, the broad affordability picture remains troubling. Real average hourly earnings fell 0.3 percent from a year earlier, the first annual decline in three years, indicating that wage growth is once again failing to keep pace with consumer prices.
Financial markets appear to believe that inflation will remain elevated well into next year. CPI swaps currently imply inflation peaking near 4.3 percent this summer before gradually easing, though still remaining above 3 percent for much of 2027. That outlook itself depends on relatively optimistic assumptions: a quick stabilization in the Middle East, reopening of the Strait of Hormuz, and normalization of both global oil flows and refinery output. Oil traders expect Saudi crude exports to China to fall sharply in coming months, Europe faces a potential jet fuel shortage, and US refiners are confronting seasonal supply pressures during the peak summer driving demand. As a result, financial institutions have sharply repriced interest rate expectations, with implied rate futures markets now assigning better-than-even odds of a Federal Reserve rate hike early next year. Even if the Fed’s preferred inflation gauge proves somewhat softer than CPI because it places less emphasis on shelter costs, the April CPI report strongly suggests that the inflation problem facing policymakers is no longer confined to volatile commodities alone.