

In his State of the Union address earlier this year, President Trump boasted that “one of the primary reasons for our country’s stunning economic turnaround, the biggest in history, where the Dow Jones broke 50,000, four years ahead of schedule, and the S&P hit 7000 where it wasn’t supposed to do it for many years, were tariffs.”
The facts tell a different story. First, because there is no schedule for stock-market gains, it is meaningless to say that the Dow Jones or S&P 500 rose “ahead of schedule.” The reality is that the US economy during the first year of President Trump’s second term simply did not perform a “turnaround,” much less one that could be ranked as “the biggest in history.”
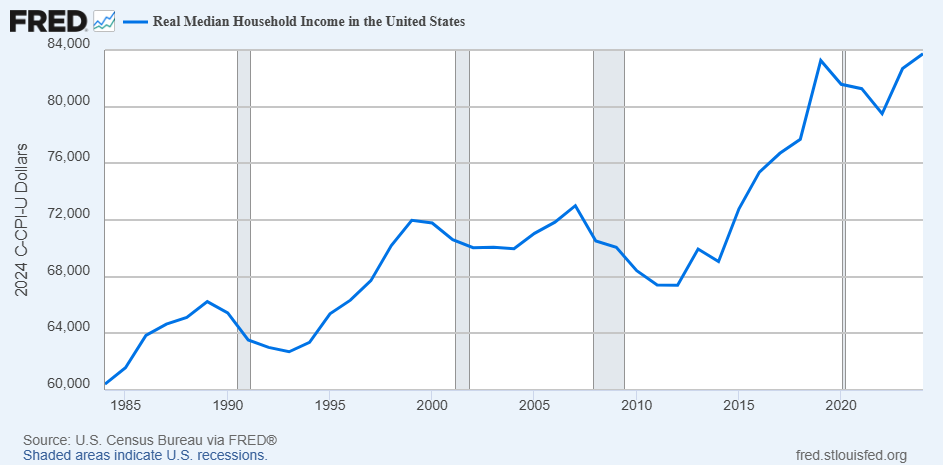
By some measures, the US economy did indeed perform better in 2025 than it did in the previous year — such as, for example, in the growth of real median household income. This income grew by 1.4 percent in 2025, which is ‘bigger’ than its 1.1 percent growth in 2024 — but not (see below) the biggest in US history. Yet by other measures — such as the growth in nonfarm employment — 2025 was a worse year. Nonfarm employment grew only by 0.2 percent between January 2025 and January 2026, after having grown by 0.8 percent between January 2024 and January 2025.
But let’s dig deeper to see if we can better determine if Mr. Trump is generally correct that the tariffs he imposed in 2025 were a boon to the American economy. To do so, we need a point of comparison for 2025 that’s more credible than 2024, which was the final year of the economy under Joe Biden’s economically harmful superintendence.
Trump 2.0 Compared to Trump 1.0
Such a point of comparison is plausibly the first full year of President Trump’s first term. Although the first full year of Mr. Trump’s second term isn’t identical to the first full year of his first term, they are similar enough to use the first year of Trump 1.0 as a ‘test’ of Mr. Trump’s boast about the first, tariff-filled year of Trump 2.0. As Phil Gramm and I wrote a few months ago in the Washington Post, “in both 2017 and 2025, Trump dramatically improved the economy’s growth potential by lifting crippling regulatory burdens imposed by his predecessors and by enacting pro-growth tax cuts. The only significant economic policy difference is the imposition of the largest tariffs since the 1930s.” Unlike in 2025, when the marquee economic policy was the tariffs, in 2017 there were no tariff hikes. The first tariff hikes in Mr. Trump’s first term weren’t even announced until late January 2018, more than a year after he was first sworn into office, and these levies didn’t take effect until February 2018.
While policy-wise the chief difference between 2025 and 2017 is the tariffs imposed in 2025, there’s one other significant difference — a non-policy one — that separates these two years. It’s a difference, however, that gave the economy in 2025 a boost that was not present in 2017. That difference is AI, which in 2025 was becoming far more integrated into the economy than it was in 2017. The presence of AI in 2025, and the optimism about its economic potential, added fuel to the 2025 economy that wasn’t available eight years earlier. But I will here do nothing to correct for the effects of that AI boost; I will thus give Mr. Trump’s boast about the effects of his tariffs on the US 2025 economy an unearned edge.
So how does the first year of Trump 2.0 compare to the first year of Trump 1.0? Even with the boost from AI investment, not well.
Financial-Market Indices
Let’s begin by looking at the performance of the three major US financial-market indices: the Dow Jones Industrial Average (DJIA), the S&P 500 index, and the NASDAQ index. These indices are especially telling because they reflect the expectations of people investing their own money. These investors have strong incentives to take account of as much available information as is worthwhile, and not to be misled by political bluster or by reality-distorting hopes and fears.
In the year from January 20, 2017 (the day Mr. Trump was first inaugurated) through January 20, 2018 (two days before the announcement of Mr. Trump’s first tariffs), the DJIA rose by a stunning 31.5 percent. In the corresponding period of Mr. Trump’s second term — January 20, 2025, through January 20, 2026 — the DJIA rose by 11.5 percent. This latter rise in the DJIA is impressive, to be sure, but it’s just over a third of the size of the rise in this index during the first year of Mr. Trump’s first term.
Like the DJIA, both the S&P 500 and the NASDAQ rose by less in the year following Mr. Trump’s second inauguration than they rose in the year following Mr. Trump’s first inauguration. Specifically, during the first year of Trump 1.0, the S&P rose by 24.1 percent and the NASDAQ by 32.1 percent, while during the first year of Trump 2.0, the S&P rose by 13.3 percent and the NASDAQ by 17.0 percent.
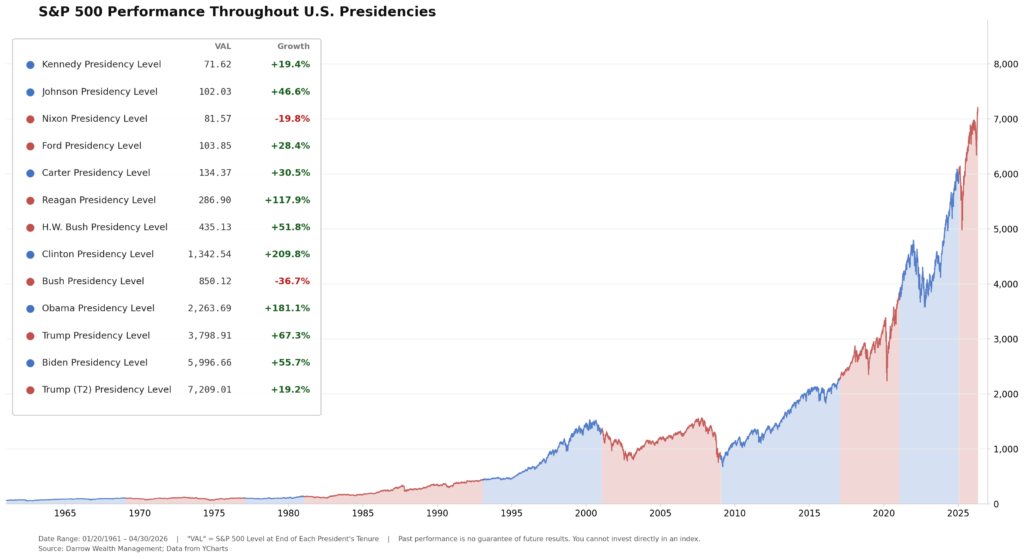
These indices — which Mr. Trump himself explicitly pointed to as evidence of the success of his second-term tariffs — performed appreciably worse with these tariffs in place than these indices performed eight years earlier before any new tariff hikes were announced.
What about other plausible measures of economic performance over the first 365 days of each of Mr. Trump’s two terms?
Manufacturing and Industrial Output
While manufacturing output rose by more (2.0 percent) during Trump 2.0 than it rose (0.7 percent) during Trump 1.0, the broader measure of industrial output — which is manufacturing plus mining and utilities — performed worse during Trump 2.0 than during Trump 1.0. From January 2025 through January 2026, industrial output rose by 1.4 percent — barely half of its 2.7 percent rise from January 2017 through January 2018.
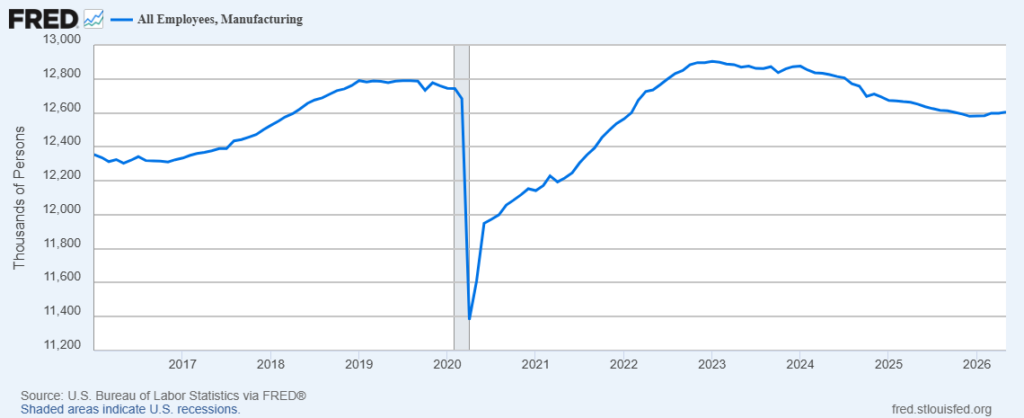
Manufacturing Employment
Manufacturing employment — an economic statistic of special concern to the White House — fell (by 0.7 percent) in the first year of Mr. Trump’s second term, after having risen (by 1.6 percent) in the first year of Mr. Trump’s first term. Serious economists find no good reason to applaud increased manufacturing employment or to fret about its decrease. But because Mr. Trump and his protectionist supporters think otherwise, it’s fair to note that Mr. Trump’s second-term tariffs failed to increase manufacturing employment.
Pay and Income
Average inflation-adjusted hourly earnings of production and nonsupervisory manufacturing workers also rose by less (1.1 percent) during the first year of Mr. Trump’s second term than they rose (1.4 percent) during the first year of his first term. More generally, from January 2025 through January 2026, average inflation-adjusted hourly earnings for all private-sector employees rose by only 0.7 percent — less than these wages rose (1.0 percent) from January 2017 through January 2018. (To adjust the nominal dollars available at these links into constant dollars I used this personal-consumption-expenditures deflator.)
The data just above are consistent with two other important measures of economic well-being: real median household income, and real per-capita GDP. While real median household income rose in 2025 by 1.4 percent, in 2017 it rose by more, by 1.9 percent. Real per-capita GDP also rose by more (2.7 percent) in 2017 than it rose (2.3 percent) in 2025.
Investment
Further, the 7.5 percent rise in real private-sector nonresidential fixed investment during the first year of Mr. Trump’s first term was notably higher than was the 5.8 percent rise during the first year of his second term.
Unemployment, Jobs, and Inflation
Two of the most familiar economic gauges are the unemployment rate and the inflation rate. Each of these measures, alas, performed worse during the first year of Trump 2.0 than during the first year of Trump 1.0. Between January 2017 and January 2018, the unemployment rate dropped from 4.7 percent to 4.0 percent, yet between January 2025 and January 2026, this rate rose from 4.0 percent to 4.3 percent. Total nonfarm employment, from January 2017 through January 2018, rose by 1.4 percent, but from January 2025 through January 2026, it rose only by an anemic 0.2 percent.
And although the fall in the rate of inflation was a bit steeper during the first year of Trump 2.0 than during the first year of Trump 1.0 — declining from an annual rate of 3.0 percent in January 2025 to 2.4 percent in January 2026 — in January 2026 inflation was still running at an annual rate higher than the annual rate of 2.1 percent that prevailed in January 2018.
A Reality Check on Trump’s Tariff Boast
Data notoriously are able to be sliced, diced, and presented in ways that convey false impressions even without the data being falsified. And to ‘test’ any given economic claim, reasonable people can disagree over which events and phenomena are the most appropriate ones to measure and report on. The reader is advised to apply the same healthy dose of skepticism to my presentation of data that he or she should bring to anyone else’s.
But I submit that the data that I present above are sufficiently broad and relevant to cast great doubt on President Trump’s boast that his 2025 tariffs have been a boon to the American economy.