
The median-priced home in America now costs $440,600, while the median household earns roughly $84,000 a year. That gap has left a growing share of Americans priced out of buying altogether, while those who already own homes and hold stocks have watched their wealth compound. The renter-owner wealth gap is now the widest on record. Meanwhile, equity markets keep setting new highs. None of this, officially, counts as inflation.
In a previous piece, I explained that the Consumer Price Index leaves out a large and growing share of what households are really forced to pay for: government spending financed by taxes rather than purchased voluntarily on markets. That is one CPI blind spot. There is a second, and it is arguably more consequential for how Americans experience economic reality. The price of stocks, homes, and other assets essentially does not appear at all in conventional inflation measures.
Why Asset Prices Fall Outside the CPI
The reason again traces back to the index-number theory Gottfried Haberler laid out in Vienna in 1927, which I’ve written about elsewhere. Haberler showed that the standard price indices economists use — Laspeyres and Paasche, and averages of the two — can be trusted as measures of an individual’s true cost of living only under a specific set of assumptions about that individual. One of those unstated assumptions is that the individual is a pure consumer: someone who spends the whole of their income on present consumption, full stop. No saving. No portfolio. No home, or even portion of a home, purchased as an investment rather than simply a place to live.
That assumption is a reasonable simplification for the sake of theoretical tractability. It is also the reason a stock portfolio or a home’s resale value has no place in a cost-of-living index built on Haberler’s logic. The CPI does track shelter, but only through “owners’ equivalent rent” — an estimate of what it would cost to rent the service flow of a home, not the price of the home as an asset. Equities do not enter the index in any form. A pure consumer, by design, does not hold assets. An index built for a pure consumer has nothing to say about what happens to their prices.
A Reasonable Exclusion with A Widening Consequence
That exclusion made the CPI theoretically coherent — it’s meant to measure consumer spending, after all. It also means that some of the fastest price inflation in the American economy over the past three decades has been completely invisible to the number the Federal Reserve targets (the PCE price index) and the media reports (the CPI).
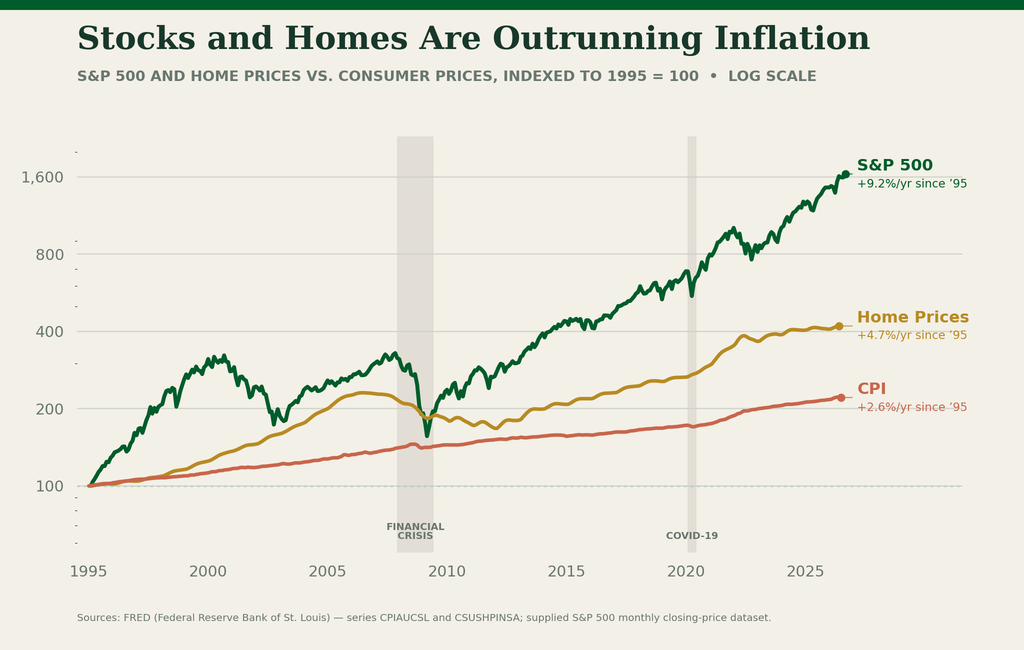
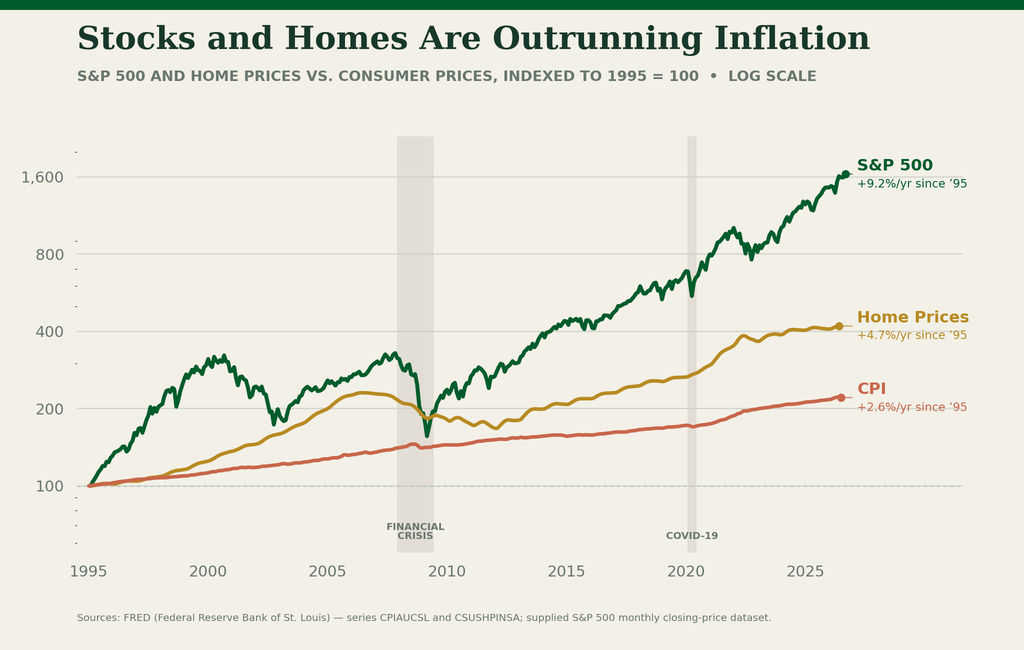
Since 1995, the S&P 500 has compounded at roughly 9.2 percent a year (15x) and home prices, as measured by the Case-Shiller index, at about 4.7 percent a year (4x). The CPI, over the same period, rose about 2.6 percent a year (2.2x). Stocks have outrun consumer prices by a factor of more than three; home prices, by nearly two. The CPI alone has no way of seeing any of these inflationary pressures — not the run-up in home prices that has priced many younger Americans out of the market, nor the equity gains flowing overwhelmingly to households that already owned assets before the run-up began.
Why Assets, in Particular?
If asset prices simply drifted upward for reasons unrelated to monetary policy, and the PCE’s and CPI’s exclusion of them was a harmless accident, we might more easily excuse CPI’s shortcomings. But there is a plausible monetary explanation for why the exclusion has mattered so much specifically since the mid-1990s.
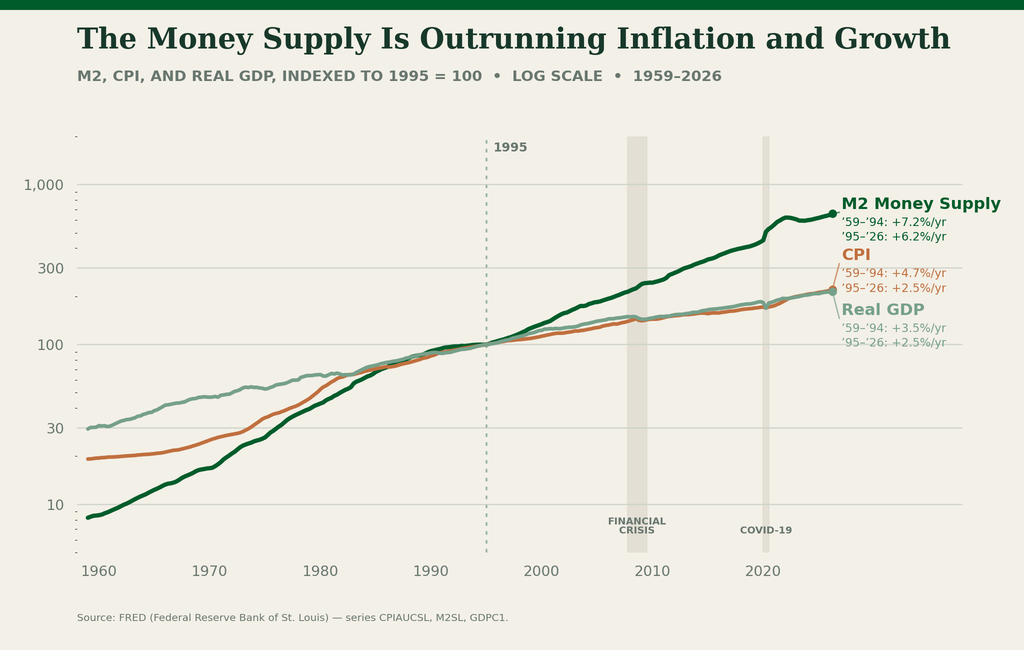
If money were neutral and its growth simply distributed itself proportionally across real output growth and consumer price inflation, the M2 money supply should grow at roughly the sum of real GDP growth and CPI inflation over time. We can check that directly: take average M2 growth and subtract the sum of average real GDP growth and average CPI growth, before and after 1995.
From 1959 through 1994, M2 grew at 7.2 percent a year, against real GDP growth of 3.5 percent and CPI inflation of 4.7 percent — a combined 8.2 percent. The gap was slightly negative: roughly 1.0 percentage point a year. Money growth, if anything, ran a bit behind the pace of real economic growth and consumer price inflation combined.
Since 1995, the picture flips. M2 has grown at 6.2 percent a year, while real GDP and the CPI have grown at 2.5 percent per year each — a combined 5.0 percent. The gap is now a positive 1.2 percentage points a year, a swing of roughly two full points from the prior 35 years.
That is not a rounding error compounding harmlessly in the background. Over three decades, a persistent 1.2-point annual gap compounds into a very large sum of money that was created by government, but not absorbed by real output growth. By definition, it did not show up as measured consumer price inflation.
Money is Not Neutral
So where did it go? Additional money does not raise every price by the same proportion, leaving the underlying structure of the economy untouched. It enters the economy at specific points — through banks, credit markets, and the institutions that first receive newly created liquidity — and its effects ripple outward unevenly from there. By the time new money reaches the people, higher prices have already consumed its extra value. Austrian economists, like Haberler’s contemporary Friedrich Hayek, have long described this with the Cantillon effect. In an economy where basic consumption needs are largely saturated for a large share of households, additional liquidity is more likely to flow into savings and investment vehicles, such as stocks and real estate, than into proportionally higher demand for groceries and clothing.
That is precisely the pattern in the data. The monetary overhang that opened up after 1995 lines up closely with the period over which stocks and home prices pulled away from the CPI. None of this proves a single, simple causal explanation. Asset prices respond to many forces, from productivity growth to demographics to global capital flows. But a persistent, multi-decade gap between money creation on the one hand and real growth plus consumer price inflation on the other is exactly the kind of monetary overhang that should show up somewhere. In a consumption-saturated economy, the most likely place for it to show up is in the price of the assets the CPI was never built to measure.
That leaves conventional inflation measures with two blind spots stacked on top of each other. The CPI omits the government-financed consumption taxpayers cannot opt out of, and it omits the asset-price inflation driving the widening gap between those who already own homes and stocks and those still trying to buy in. Neither omission is a flaw in how the CPI is calculated. Both are consequences of what the CPI was, by its own underlying economic theory, never designed to measure.
