
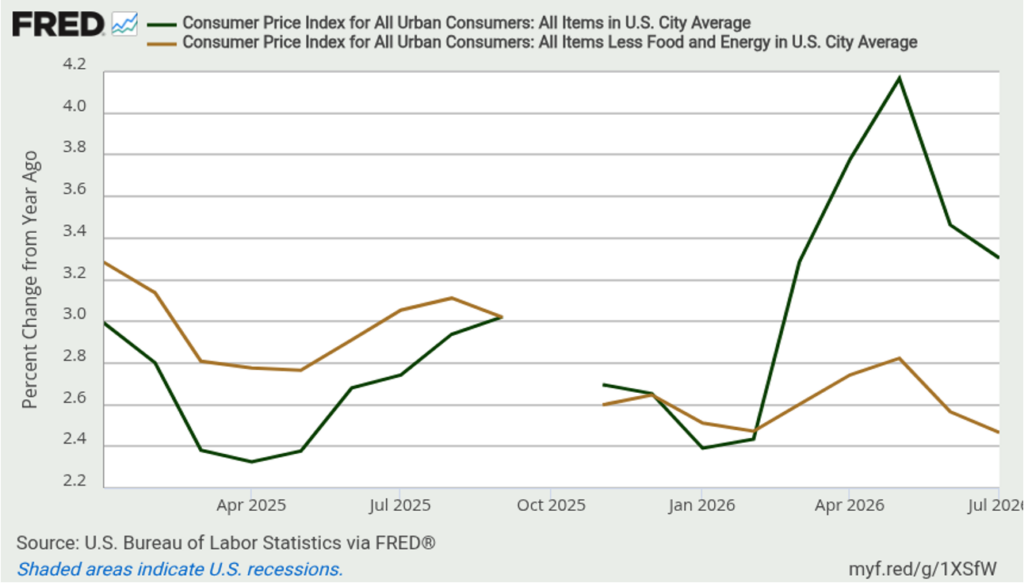
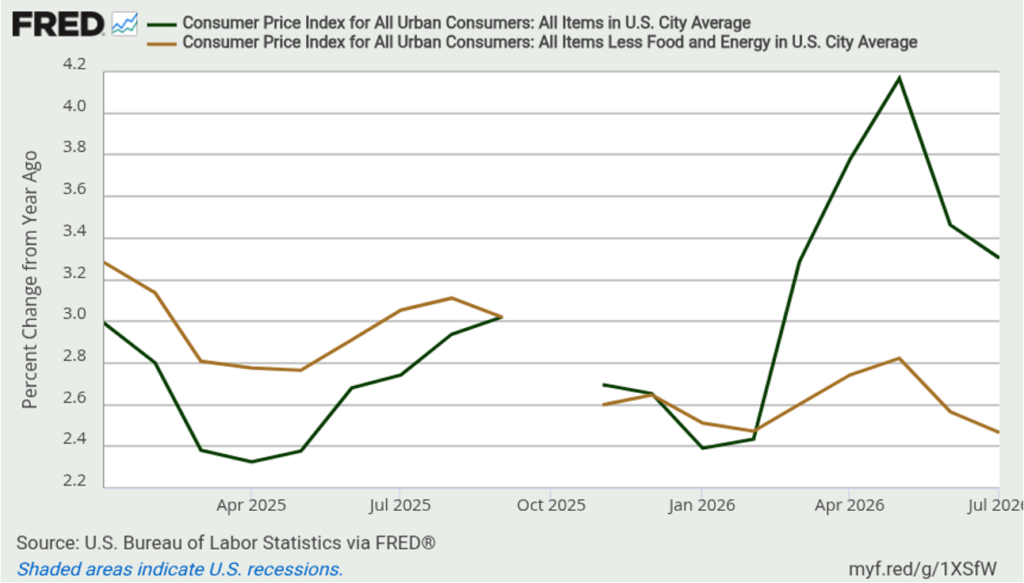
Inflation crept back up in July, though not by much. The Consumer Price Index (CPI) rose 0.1 percent last month, a modest reversal after June’s 0.4 percent decline. The year-over-year rate eased slightly, to 3.4 percent from 3.5 percent.
Core inflation, which excludes food and energy, told a similar story. Core CPI rose 0.2 percent in July after being flat in June. The year-over-year core rate ticked down to 2.5 percent from 2.6 percent — another small move.
Last month’s headline decline was almost entirely an energy story, as oil prices moderated with the anticipated reopening of the Strait of Hormuz. In July, housing took over as the main driver. Shelter rose 0.1 percent over the month, accounting for roughly two-thirds of the monthly increase in the headline index. Energy fell 1.5 percent, with gasoline down 2.9 percent, continuing the retreat that began in June. The shift matters: energy moves are volatile and often reverse quickly, while shelter tends to be stickier.
Price increases in July were broad. Medical care, airline fares, communication, education, and recreation all rose, with airline fares up 2.2 percent on the month, driven by higher prices for jet fuel. Motor vehicle insurance was one of the major categories contributing to a decline in the index, down 0.3 percent, although less than its 2.0 percent drop in June.
The Three-Month Point of View
The three-month trend annualized, which can help filter out some of the monthly noise, tells a cooler story than either the monthly or annual figures suggest. Headline CPI rose at roughly a 0.8 percent annualized rate over the three months through July, well below the 3.4 percent year-over-year figure. Core, which strips out energy, rose faster over the same stretch, at roughly 1.6 percent annualized — still below its 2.5 percent year-over-year pace but a smaller gap. The wider gap on the headline number shows that a few volatile months of energy prices can lead to huge swings.
Markets are more confident that the Fed will hold rates steady. The CME Group’s FedWatch tool puts the odds of a hold around 65 percent in September and 50 percent in October, following yesterday’s steady PPI print.
The labor market gave the Fed more reasons to lean that way. The latest data indicate nonfarm payrolls fell by 23,000 in July, and May and June were revised down by a combined 103,000. The unemployment rate fell slightly from 4.2 percent to 4.1 percent, but the participation rate has now declined 0.7 percentage points since January. Year-over-year average hourly earnings decelerated from 3.5 percent in June to 3.2 percent in July. This is not a labor market showing acute stress, but it is no longer the source of comfort it was earlier this year.
The Nominal Income Point of View
Inflation can react to either nominal or real shocks, which makes it an indirect measure of where monetary policy actually stands. Nominal income, by contrast, is a direct measure of whether policy is loose, about right, or restrictive, since it isolates the nominal side of the economy from the real shock noise that CPI can’t filter out on its own.
Between Q2 2025 and Q2 2026, nominal GDP grew 6.5 percent, a significant increase compared to the 4.6 percent growth between Q1 2025 and Q1 2026. That elevated trend sits uncomfortably above the roughly four-percent pace that prevailed before the pandemic.
Despite signs of a weakening labor market and a three-month CPI trend below 2 percent annualized, the Fed faces a dilemma. CPI and payroll data reflect the current state of prices and hiring, both of which show signs of deceleration. Meanwhile, nominal spending indicates demand is still robust, and this demand hasn’t slowed sufficiently to suggest that the recent cooling is anything but temporary. If nominal spending remains strong, the softer CPI and employment figures are more likely indicators of a lag rather than a true shift in trend.
July 2026 CPI at a Glance
| Category | Month-over-Month (July) | 3-Month Annualized | Year-over-Year |
| All items | 0.1% | 0.8% | 3.4% |
| All items less food and energy | 0.2% | 1.6% | 2.5% |
| Food | 0.1% | 2.0% | 3.0% |
| Energy | -1.5% | -13.3% | 14.7% |
| Shelter | 0.1% | 2.0% | 3.2% |
| Transportation services | 0.3% | -2.4% | 2.9% |
| Medical care services | 0.6% | 4.1% | 2.7% |
The next CPI report for August is scheduled for release on Friday, September 11, 2026.
