
The February 2026 AIER Business Conditions Monthly (BCM) highlights a notable divergence across the economic cycle, with forward-looking indicators softening, contemporaneous measures deteriorating, and lagging data continuing to reflect earlier resilience, although some of this pattern may be influenced by incomplete data and ongoing catch-up from prior reporting gaps.
LEADING INDICATOR (46)
The Leading Indicator registered 46, with five of 12 components improving, one unchanged, and six declining.
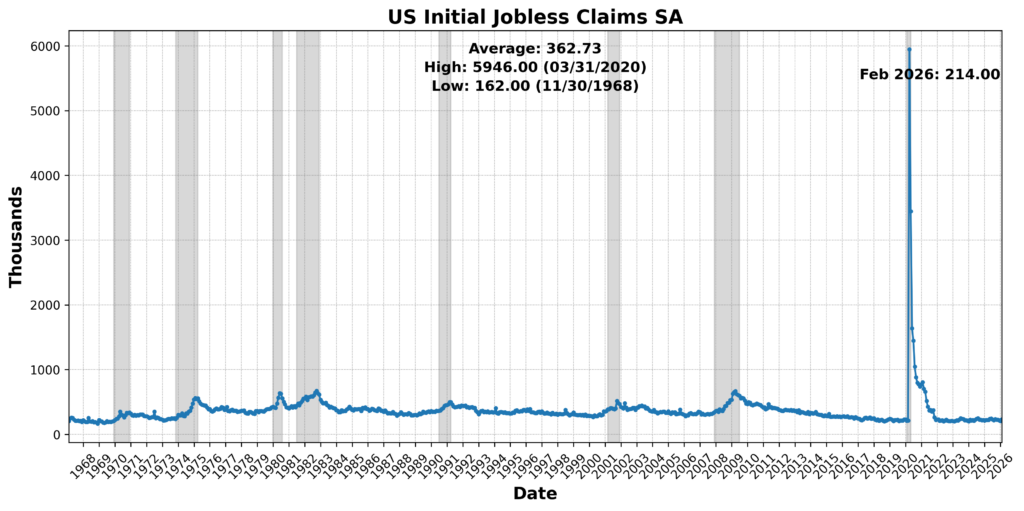
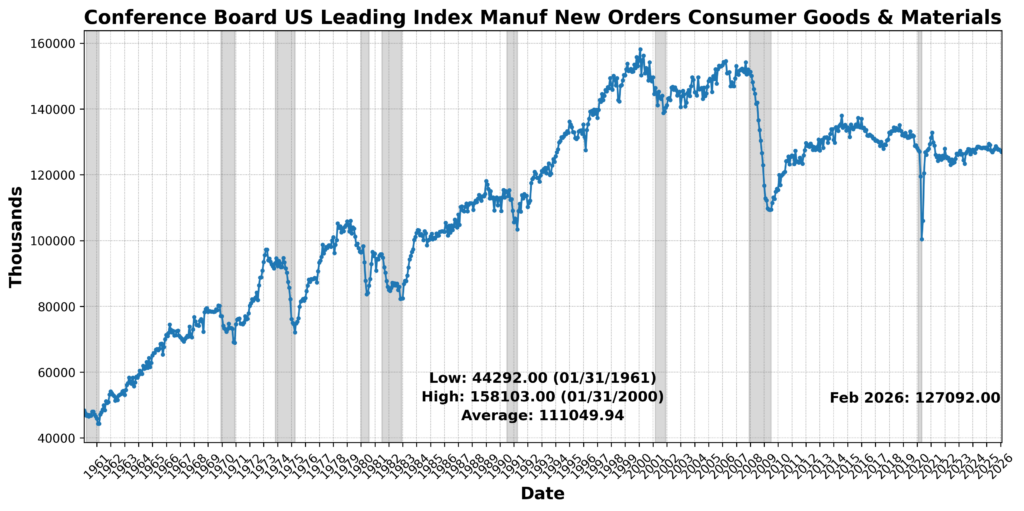
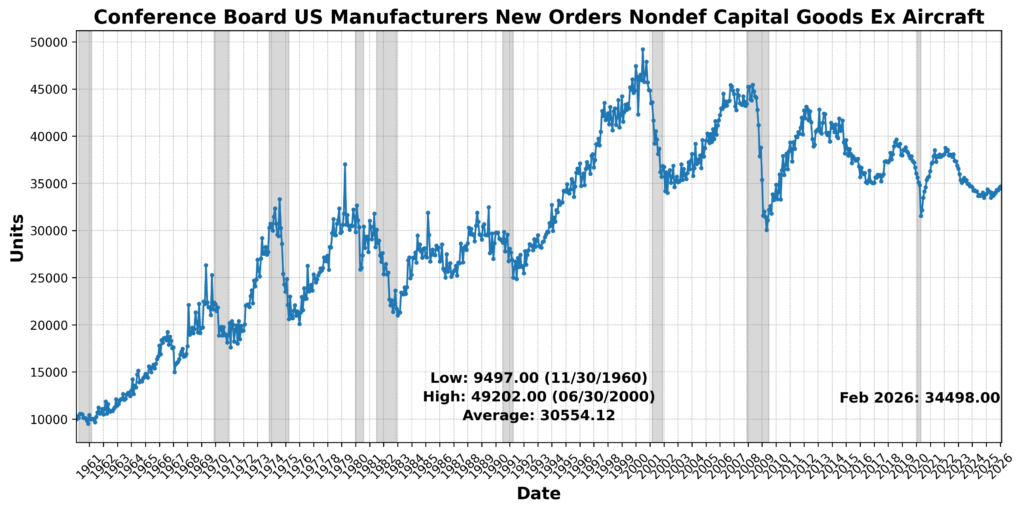
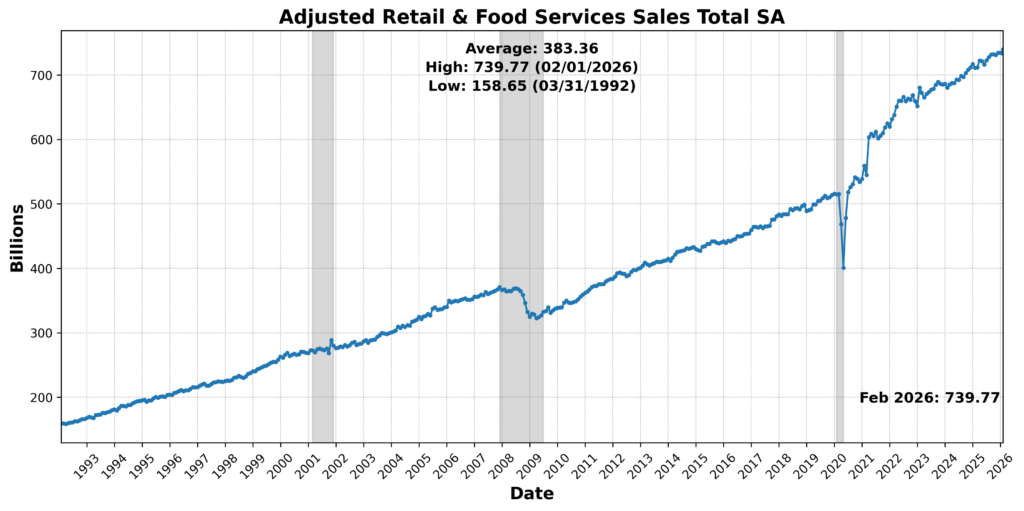
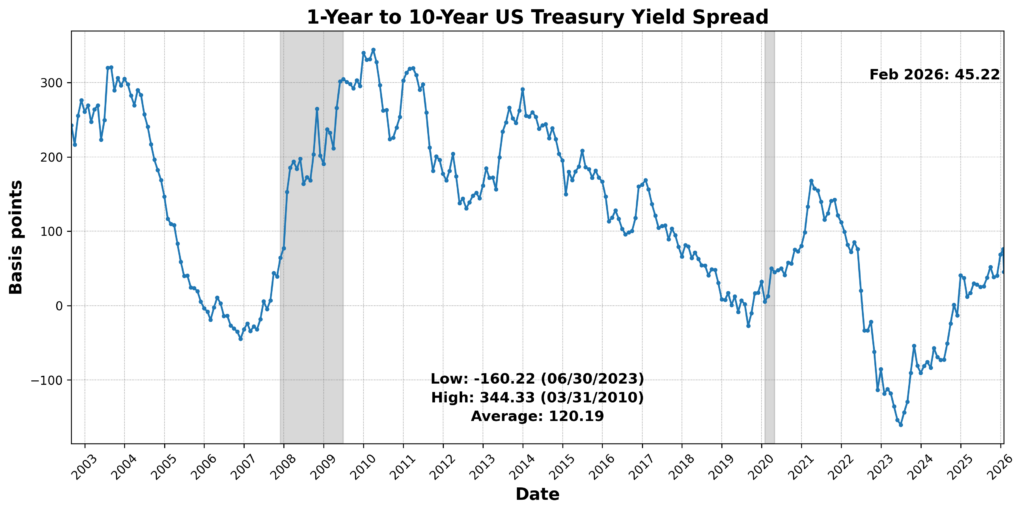
Advances were concentrated in a handful of forward-looking and demand-related measures. The 1-Year to 10-Year US Treasury Yield Spread narrowed sharply by 40.4 percent but was scored positively given its inversion. Labor-market forward conditions strengthened as US Initial Jobless Claims SA declined 7.0 percent (a positive after inversion). Adjusted Retail and Food Services Sales Total SA increased 0.7 percent, while the Conference Board US Manufacturers New Orders Nondefense Capital Goods Ex Aircraft rose 0.5 percent. The Conference Board US Leading Index Manufacturers’ New Orders Consumer Goods and Materials edged higher by 0.1 percent.
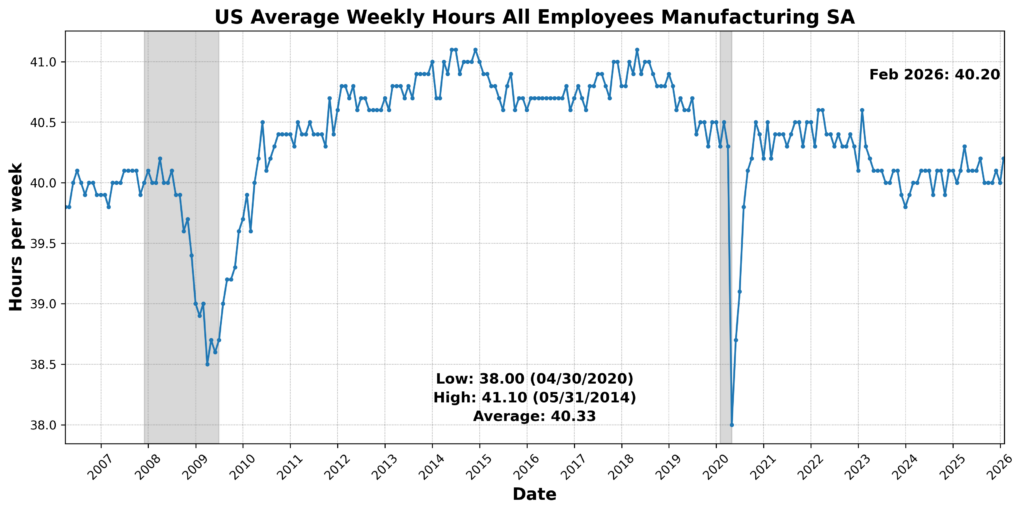
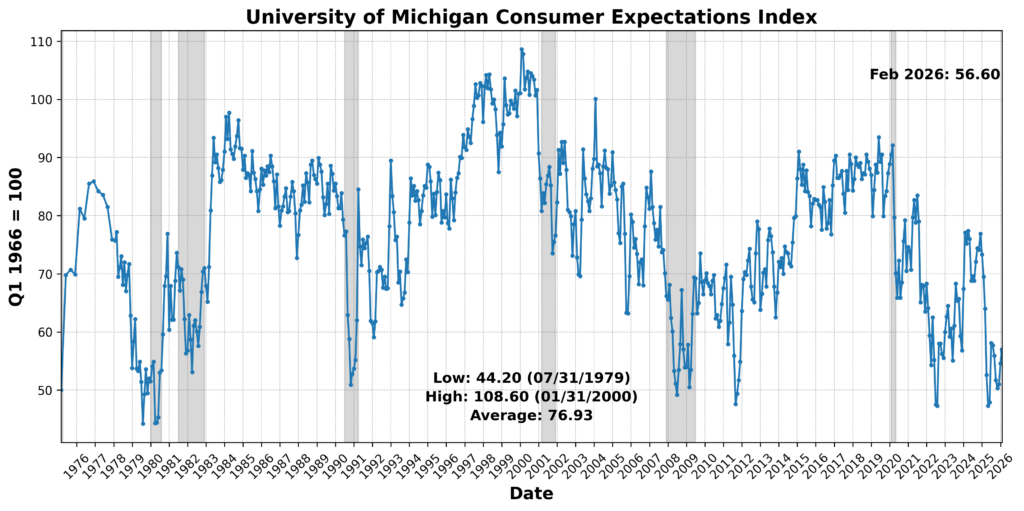
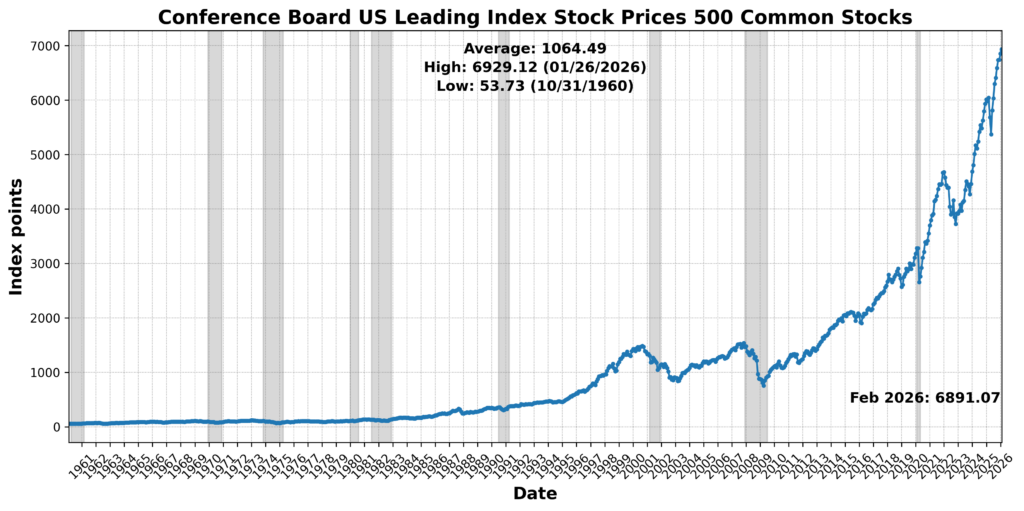
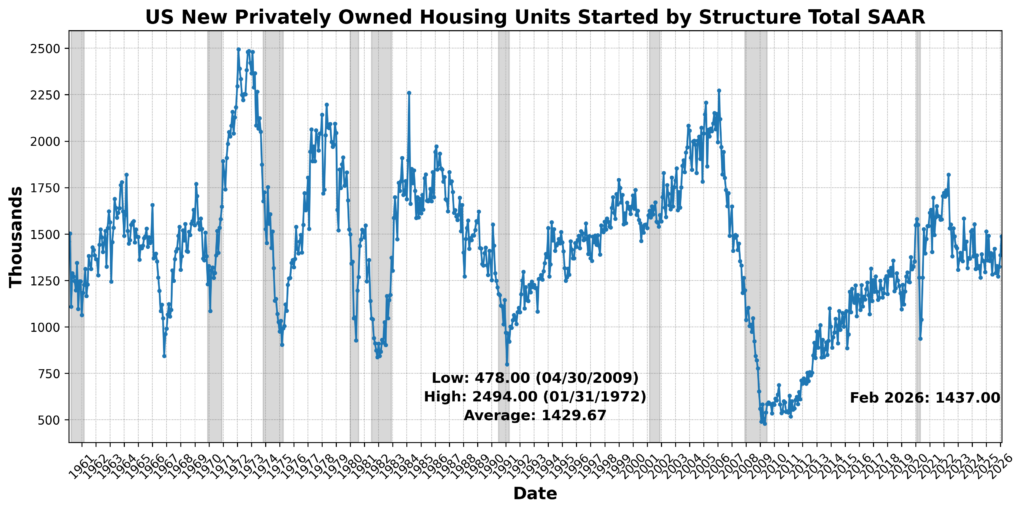
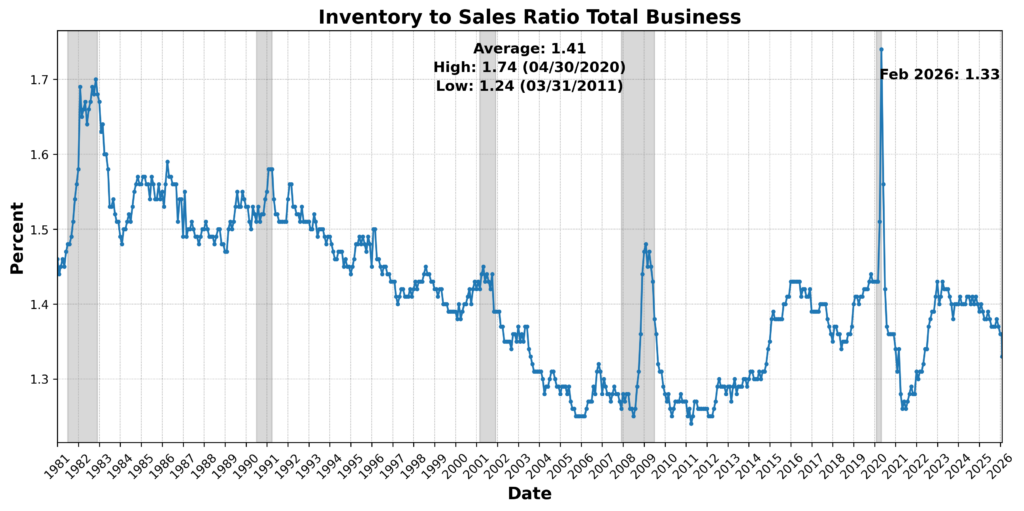
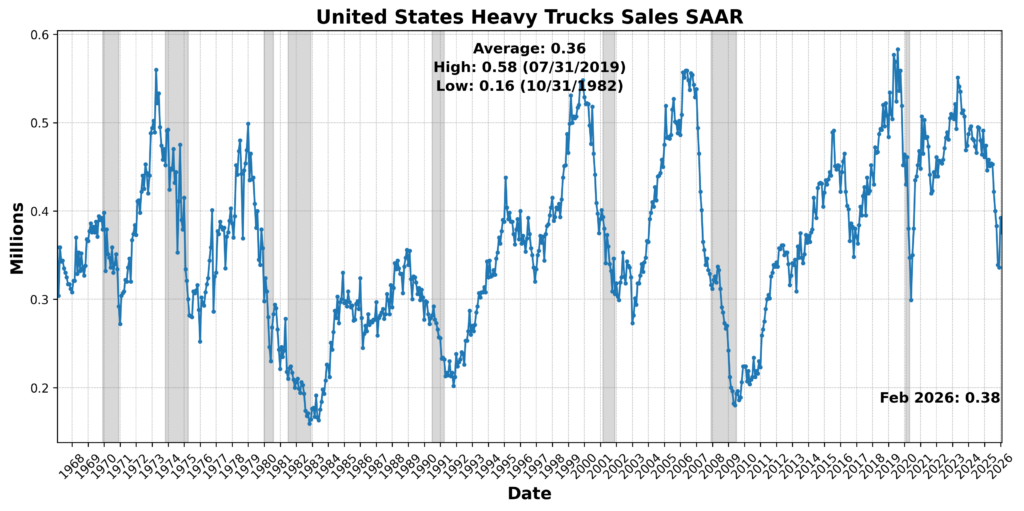
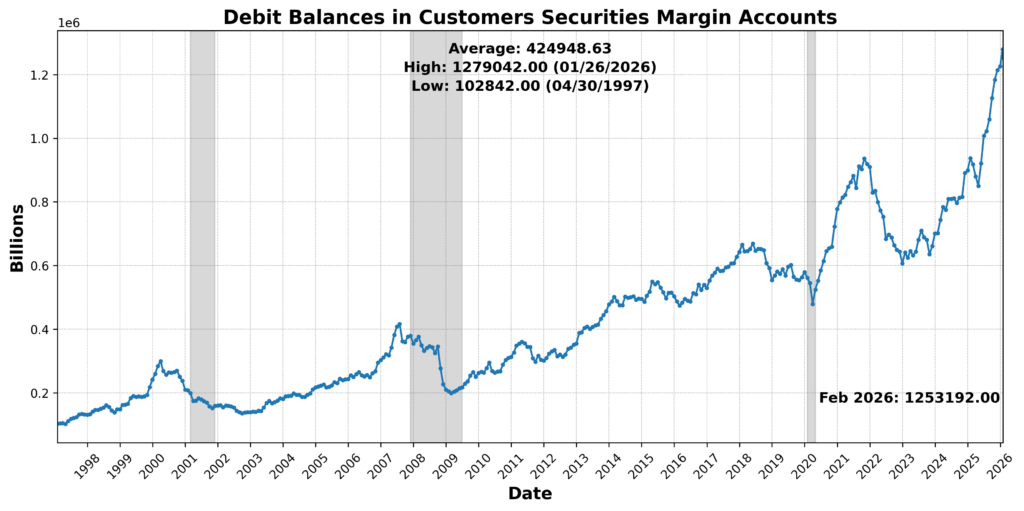
These gains were outweighed by declines across several key areas. The Conference Board US Leading Index Stock Prices 500 Common Stocks fell 0.6 percent, and the University of Michigan Consumer Expectations Index declined 0.7 percent. The Inventory-to-Sales Ratio Total Business dropped 1.5 percent, and Debit Balances in Customers’ Securities Margin Accounts decreased 2.0 percent. United States Heavy Truck Sales SAAR fell 3.3 percent, while US New Privately Owned Housing Units Started by Structure Total SAAR declined 3.4 percent. US Average Weekly Hours All Employees Manufacturing SA was unchanged.
Taken together, the leading components point to a loss of momentum in forward indicators, with isolated areas of strength unable to offset broader softness in housing, expectations, and financial market signals.
ROUGHLY COINCIDENT INDICATOR (17)
The Roughly Coincident Indicator came in at 17, with one component improving and five declining.
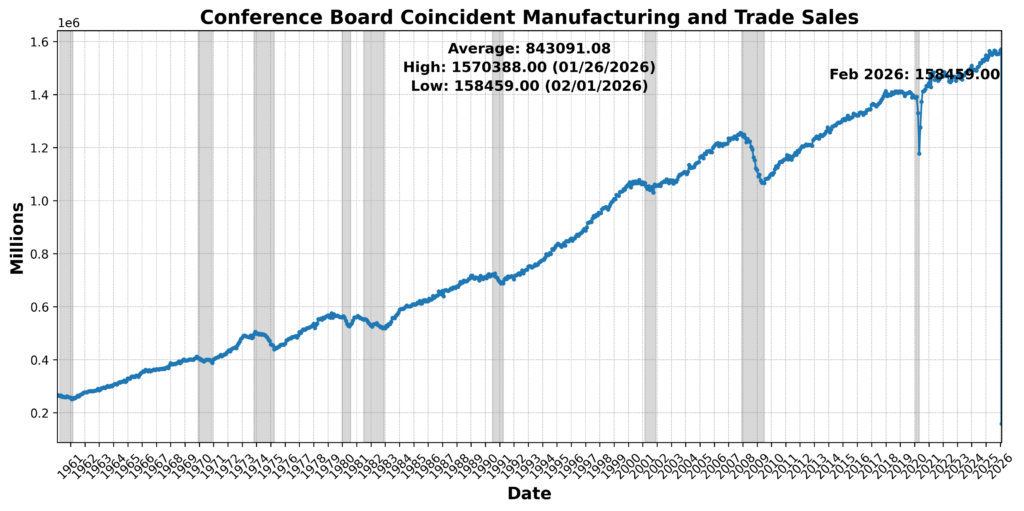
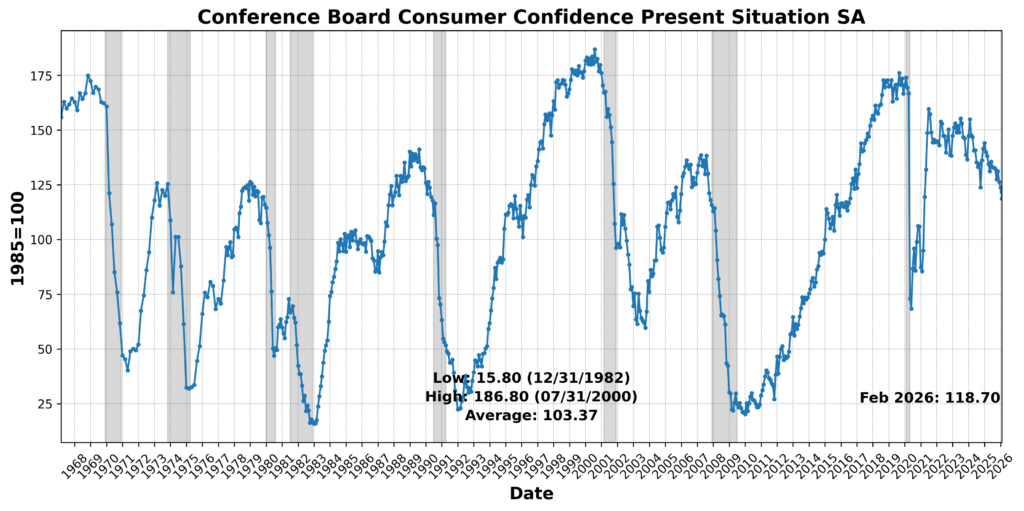
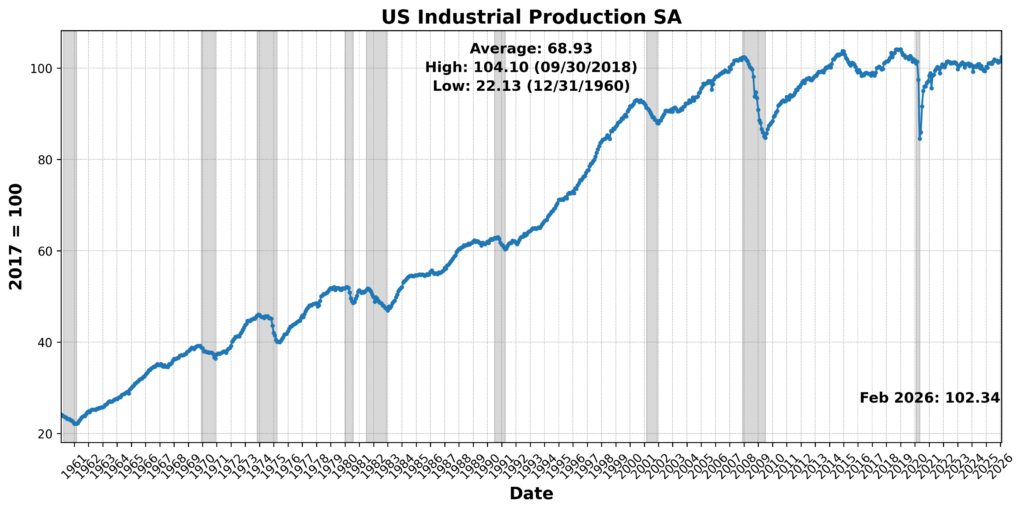
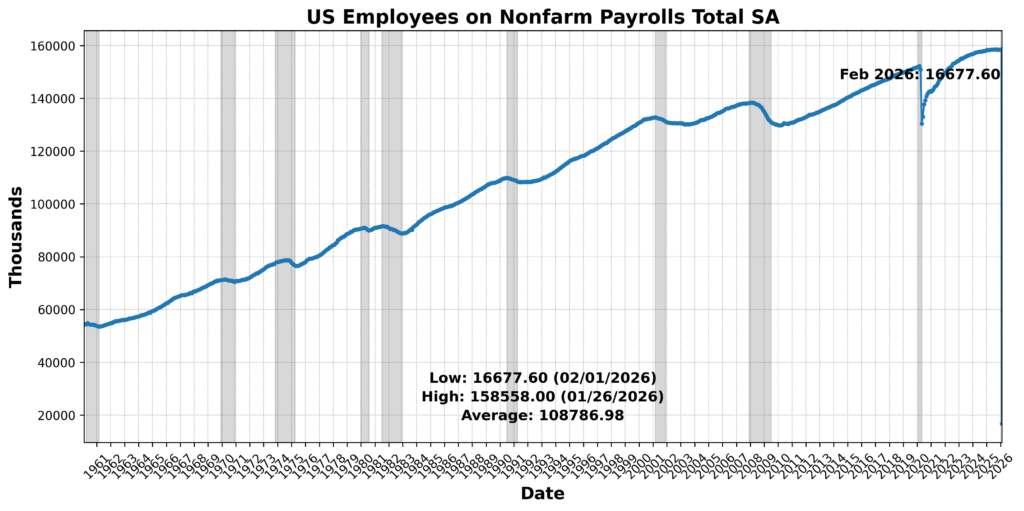
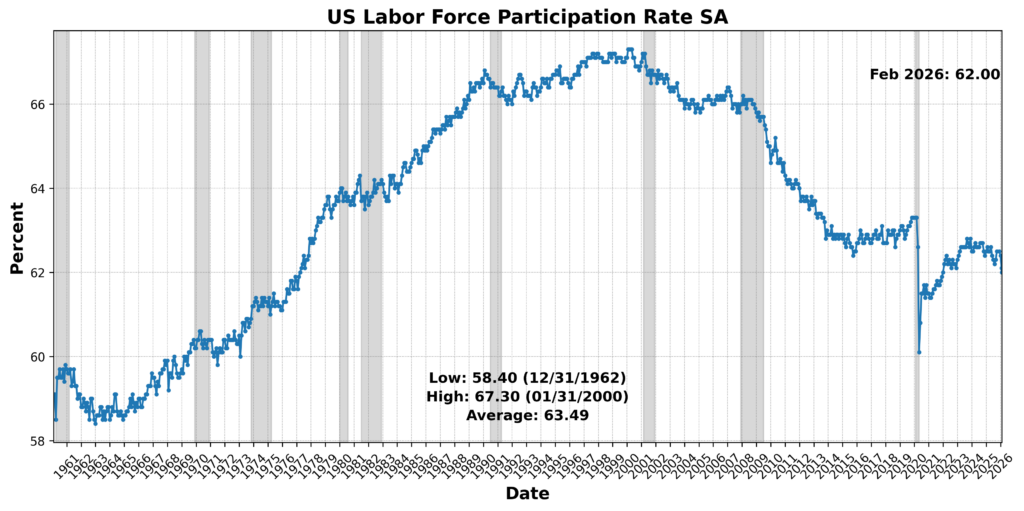
US Industrial Production increased 0.7 percent, representing the sole area of strength. Elsewhere, conditions weakened: Conference Board Coincident Manufacturing and Trade Sales slipped 0.1 percent, while US Employees on Nonfarm Payrolls Total SA was essentially flat, posting a slight decline. US Labor Force Participation Rate edged down 0.2 percent, and Conference Board Coincident Personal Income Less Transfer Payments fell 0.4 percent. Conference Board Consumer Confidence Present Situation SA dropped 2.5 percent.
Overall, the coincident data depict a soft and weakening current environment, where declines in income, participation, and sentiment outweigh modest gains in production.
LAGGING INDICATOR (67)
The Lagging Indicator stood at 67, with four components improving and two declining.
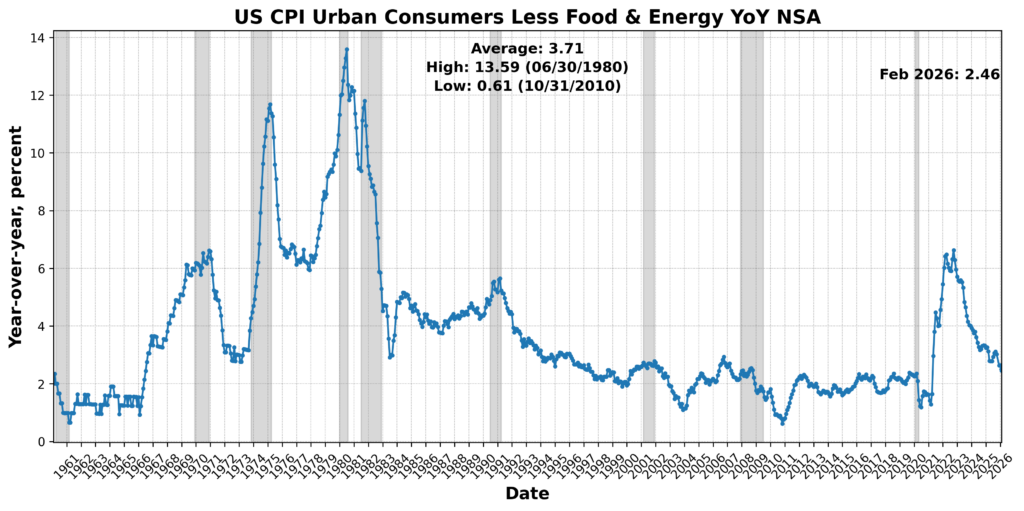
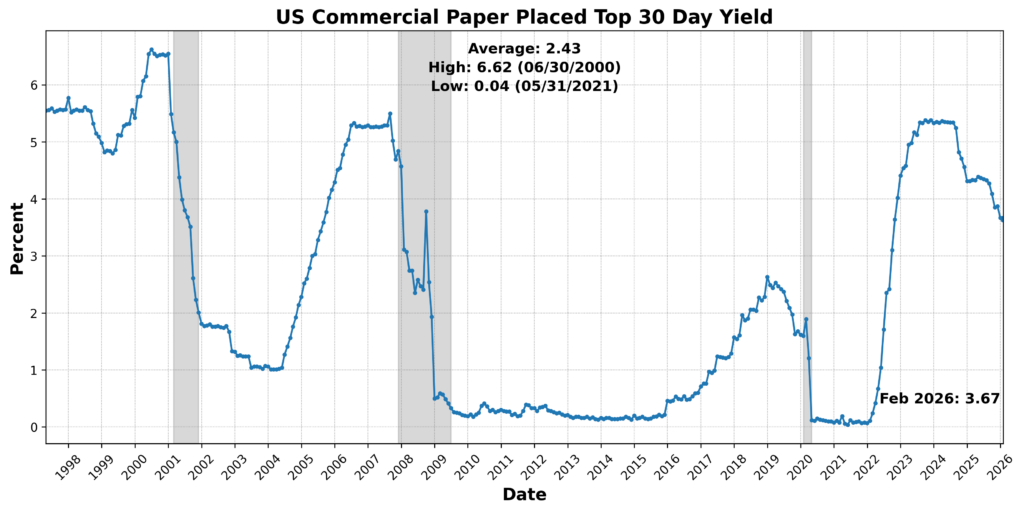
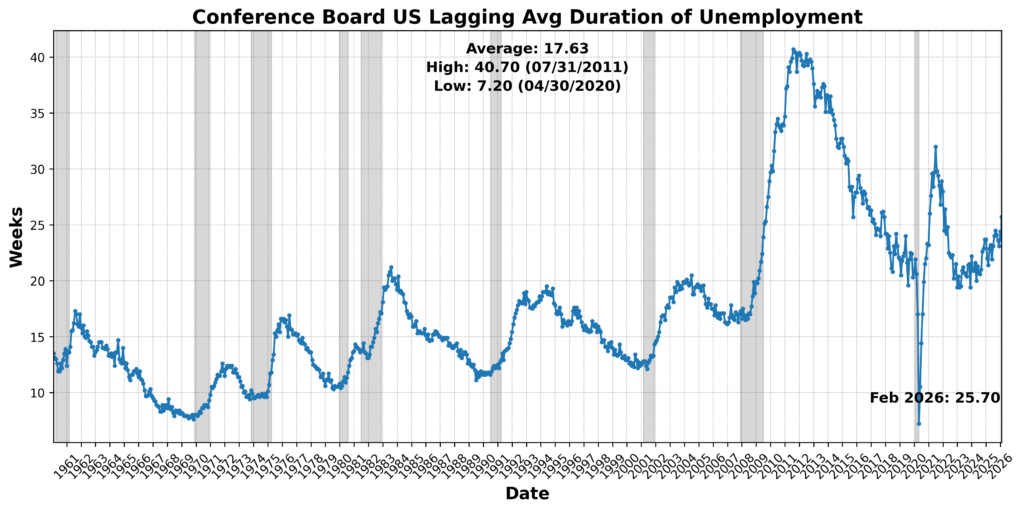
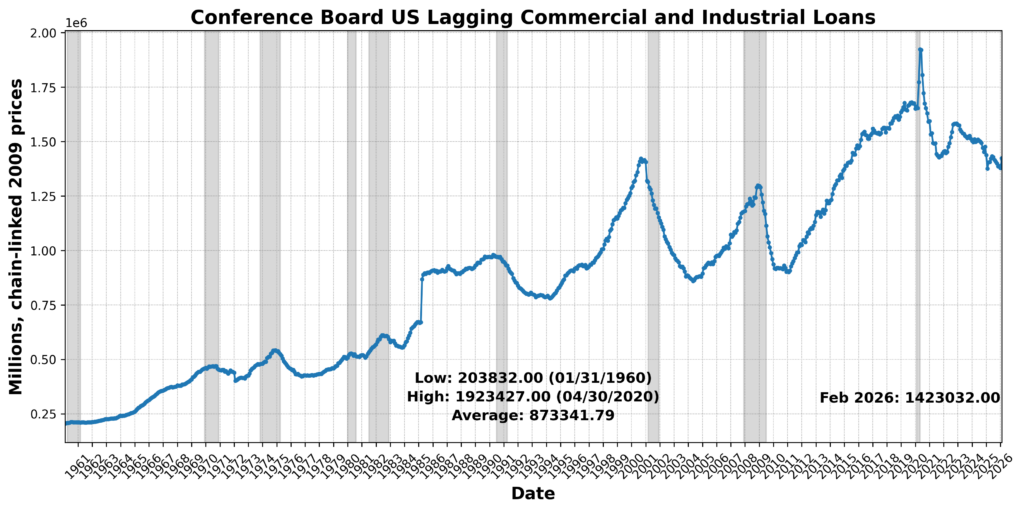
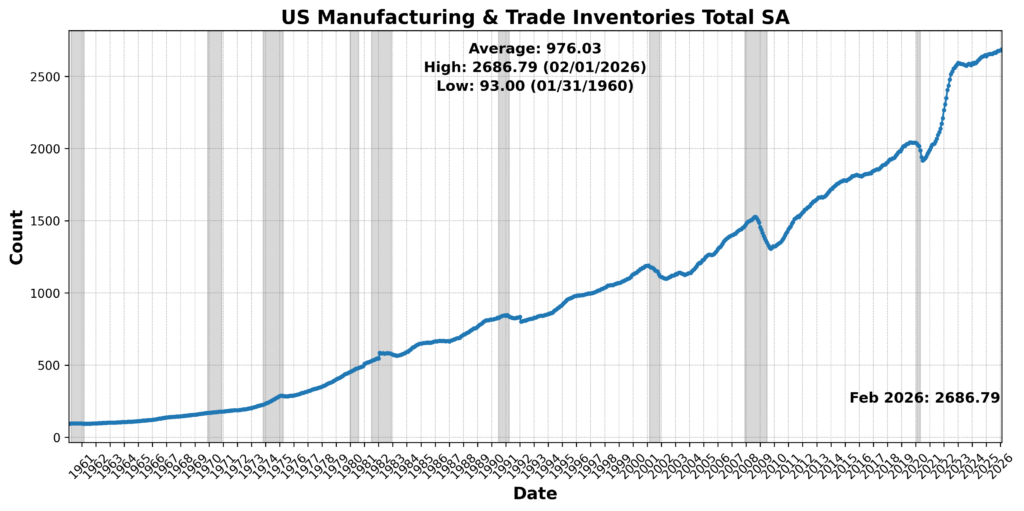
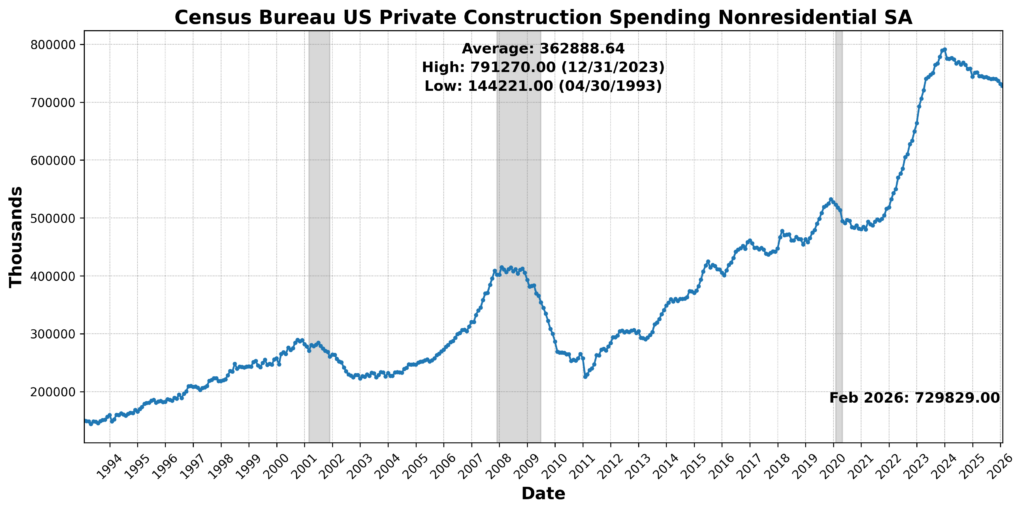
Strength was concentrated in credit and inventory measures. Conference Board US Lagging Commercial and Industrial Loans rose 2.1 percent, while US Commercial Paper Placed Top 30 Day Yield increased 1.1 percent. US Manufacturing and Trade Inventories Total SA advanced 0.4 percent, and Census Bureau US Private Construction Spending Nonresidential SA increased 0.2 percent. Against this, US CPI Urban Consumers Less Food and Energy Year over Year NSA declined 1.9 percent, and the Conference Board US Lagging Average Duration of Unemployment rose 8.4 percent and was scored negatively after inversion.
The lagging components continue to reflect underlying firmness in credit conditions and inventories, though the increase in unemployment duration and easing inflation suggest that slack is beginning to emerge beneath the surface.
The February 2026 BCM readings point to a deterioration in forward and contemporaneous conditions alongside continued firmness in trailing measures. The Leading Indicator (46) signals fading momentum, with gains in select demand indicators overshadowed by declines in housing, expectations, and market-based measures. The Roughly Coincident Indicator (17) underscores a weak present, marked by broad-based softness in income, participation, and sentiment. By contrast, the Lagging Indicator (67) reflects residual strength in credit and inventory accumulation, even as labor market strains begin to build. Compared with January’s configuration (63, 42, 33), the shift is notable: forward and current indicators have weakened materially, while lagging measures have strengthened, consistent with a loss of economic momentum. Taken together, the pattern suggests an economy transitioning from uneven expansion toward a more fragile footing.
As with the prior release, these figures should be interpreted with caution, as the data continue to fill in following recent gaps and may not yet provide a fully reliable picture of underlying trends.
DISCUSSION, March–April 2026
March’s CPI report reflects a sharp but narrowly driven acceleration in headline inflation, with gasoline prices — surging in the wake of the Iran conflict — accounting for the bulk of the increase. Headline CPI rose 0.87 percent month-over-month, the fastest pace in nearly four years, lifting the year-over-year rate to 3.3 percent from 2.4 percent. In contrast, core CPI remained subdued at 0.20 percent on the month and 2.6 percent year-over-year, as easing in services and stability across several heavily weighted goods categories helped contain broader price pressures. Energy alone contributed roughly 70 basis points to the monthly headline gain, with gasoline prices jumping over 21 percent on a seasonally adjusted basis — the largest increase on record. Outside of energy and a modest pickup in airfares, the transmission of higher commodity prices into consumer prices remains limited for now, reflecting the typical lag in pass-through. Food prices were largely flat, while core goods inflation held at 0.1 percent amid a mix of declines in categories such as used cars, household furnishings, and prescription drugs, offset by strength in technology-related goods tied to memory-chip shortages and selective increases in apparel and recreation items.
Beneath the surface, inflation dynamics remain mixed but relatively contained, with some evidence of modest firming in the breadth of price increases alongside continued softness in key service categories. The share of core components running above the Fed’s two-percent target edged higher, though still below levels seen in prior years, while core services inflation slowed to 0.2 percent despite a slight reacceleration in rents. Discretionary services — including travel, lodging, and recreation — showed signs of weakening, potentially reflecting early consumer sensitivity to higher fuel costs. Looking ahead, near-term inflation is likely to remain elevated as energy prices continue to feed through, with additional pressure expected in airfares and a possible one-time firming in rents. However, a recently announced ceasefire and still-muted core trends suggest that underlying inflation may remain manageable. Against this backdrop, the Federal Reserve is likely to maintain a wait-and-see posture, holding rates steady through much of 2026 as it assesses the balance between transient energy-driven inflation and a still-cooling core, with markets continuing to price limited near-term policy easing.
Complementing this picture, February’s PCE data indicate that underlying inflation pressures were already firming before the Iran conflict, particularly within goods categories tied to global supply chains. Core PCE — the Fed’s preferred gauge — remained elevated near 3 percent year-over-year, with shorter-run annualized measures moving higher, driven in part by durable goods such as vehicles, apparel, and technology-related components linked to memory-chip shortages. At the same time, service-sector inflation showed signs of moderation, with categories such as health care and recreation contributing less to overall price growth. Notably, core PCE appears to have accelerated relative to core CPI, reversing its typical relationship and widening the gap between the two measures to unusually large levels. This divergence reflects differences in composition and weighting — particularly PCE’s greater exposure to financial services, food services, and technology-related goods — while also highlighting how sector-specific shocks can shape broader inflation readings.
Taken together, the data suggest an inflation environment that is neither reaccelerating broadly nor decisively cooling, but instead being shaped by a shifting mix of supply-side pressures and uneven demand. Energy and goods-related shocks are pushing headline measures higher and adding volatility to core readings, while services — still the dominant driver of inflation — are gradually easing but remain firm enough to prevent a rapid return to target. As of early April 2026, U.S. inflation appears increasingly bifurcated: headline measures are being driven by geopolitical and commodity shocks, while underlying inflation is moderating only slowly and unevenly. This leaves the overall trajectory uncertain, with inflation neither clearly reaccelerating nor convincingly returning to the Federal Reserve’s two-percent objective.
Recent labor market data present a picture of resilience in the near term, though much of the apparent strength reflects temporary factors rather than a clear reacceleration in underlying demand. March payrolls rebounded by 178,000 following a weather- and strike-depressed February, with gains concentrated in sectors that had previously been disrupted, including leisure and hospitality, construction, and health care. The resolution of the Kaiser Permanente strike alone mechanically boosted employment, while improved weather conditions supported hiring in cyclical sectors. Private payrolls rose 186,000, led by services, though pockets of weakness persisted in professional and business services, finance, and information — areas likely facing structural adjustments, including ongoing layoffs tied to technological change. Wage growth moderated to 0.2 percent, and a slight decline in hours worked weighed on aggregate income, suggesting that labor-market momentum remains modest beneath the headline rebound. The unemployment rate fell to 4.26 percent, though this was driven in part by a decline in labor-force participation, pointing to a labor market that is stable but not tightening materially.
Broader indicators continue to signal a gradual cooling in labor demand, reinforcing the view that conditions are settling rather than strengthening. Job openings declined to 6.88 million in February, while the hiring rate fell to its lowest level since 2020, reflecting employer caution amid rising costs and growing uncertainty even before the escalation of the Iran conflict. The ratio of vacancies to unemployed workers remains below one, indicating that labor supply is no longer being outpaced by demand, while the quits rate has fallen to pandemic-era lows, suggesting reduced worker confidence in job mobility. Initial jobless claims have edged higher but remain historically contained and geographically limited, underscoring the absence of broad-based layoffs. Taken together, the data suggest a labor market that is holding up in the short run — supported by temporary rebounds and seasonal factors — but gradually losing dynamism. Looking ahead, higher input costs and tighter financial conditions could weigh more heavily on hiring in the second half of the year, leaving policymakers inclined to remain patient as they assess whether current stability gives way to more meaningful softening.
March’s ISM Manufacturing report suggests continued expansion, though the underlying details point to a more nuanced and less robust picture than the headline implies. The PMI rose to 52.7, supported largely by slower supplier deliveries and inventory drawdowns tied to supply disruptions stemming from the Iran conflict, rather than a broad-based strengthening in demand. In contrast, forward-looking components softened: new orders eased to 53.5, export demand declined, and order backlogs grew more slowly, indicating some loss of momentum on the demand side. Production picked up, and inventories were depleted more quickly, consistent with firms working through constrained supply chains rather than responding to accelerating end demand. At the same time, the prices-paid index surged to 78.3, reflecting a sharp rise in input costs, while employment continued to contract modestly. Taken together, the report points to an industrial sector still expanding but increasingly shaped by the tension between rising costs and moderating demand, with supply-side disruptions playing an outsized role in recent strength.
The ISM Services report, by contrast, highlights continued growth but with clearer signs of strain from rising costs and operational pressures. The headline index declined to 54.0 from 56.1, remaining in expansion territory but marking a loss of momentum, even as new orders strengthened further and export demand improved. Beneath the surface, however, firms are facing a sharp increase in input costs, with the prices index jumping to 70.7 — the largest monthly gain in nearly 14 years — and supply chains showing renewed signs of stress. These pressures appear to be weighing on hiring, with the employment component falling into contraction for the first time in several months, and production slowing. Business commentary points to rising fuel costs, logistical disruptions, and broader geopolitical uncertainty as key challenges, particularly in transportation and travel-related industries. Overall, the services sector remains a source of growth, but the combination of firm demand and intensifying cost pressures introduces a more balanced and uncertain outlook, especially as firms adjust hiring and investment decisions in response to the evolving environment.
Recent sentiment data across consumers and small businesses suggest a modest improvement in current conditions but a growing sense of caution about the outlook, particularly as rising energy costs and geopolitical uncertainty begin to weigh on expectations. The Conference Board’s consumer confidence index edged higher in March, driven by a stronger assessment of present conditions and a still-stable view of the labor market, with slightly more consumers reporting jobs as plentiful. However, forward-looking components weakened, including expectations for income, employment, and spending across services categories. At the same time, inflation expectations moved sharply higher, with year-ahead expectations rising above 6 percent, signaling that higher oil prices are beginning to shape household perceptions. The University of Michigan survey paints a somewhat softer picture overall, with headline sentiment declining and both current conditions and expectations deteriorating, particularly after the onset of the Iran conflict. While short-term inflation expectations rose, longer-term expectations remained relatively anchored, suggesting consumers still view the current price pressures as at least partially transitory.
Small-business sentiment also softened meaningfully in March, reflecting rising costs and elevated uncertainty, though the deterioration remains concentrated in expectations rather than current activity. The NFIB Small Business Optimism Index fell below its long-run average for the first time in nearly a year, driven by weaker profit trends, declining expectations for business conditions, and reduced plans for capital spending. At the same time, hiring plans held steady and expected real sales eased only modestly, indicating that firms have yet to materially pull back on operations. The sharp rise in the uncertainty index underscores the role of policy, cost pressures, and geopolitical developments in shaping business outlooks. Taken together, the data suggest a sentiment environment that is holding up at present but becoming increasingly fragile, with rising inflation expectations and uncertainty posing risks to both consumer spending and business investment in the months ahead.
Recent retail and consumption data point to a consumer sector that remains nominally resilient but is showing clearer signs of strain once adjusted for inflation and income dynamics. Headline retail sales rose a strong 1.7 percent in March, boosted in large part by higher gasoline prices, with gains broadly distributed across categories including furniture, general merchandise, and online spending. Even excluding autos and gas, sales increased a solid 0.6 percent, and control-group sales — a key input into GDP — rose 0.7 percent. However, much of this strength appears to reflect price effects and temporary supports such as tax refunds and higher-income spending, rather than a sustained acceleration in real demand. In real terms, control-group sales were likely flat, consistent with a slowdown in first-quarter consumption growth to around 1.0 percent from 1.9 percent previously. Earlier PCE data reinforce this softer underlying picture: real personal spending rose just 0.1 percent in February, with services — typically the more stable component — slowing to its weakest pace in several months, while goods spending was constrained by rising prices in categories such as vehicles and technology-related items.
At the same time, income growth has softened, adding to pressure on household finances. Personal income declined modestly in February, with slower gains in compensation and declines in transfer payments and dividend income weighing on the headline. With spending continuing to outpace income, the saving rate fell to 4.0 percent, while real disposable income growth has slowed to one of its weakest rates in recent years. This combination suggests that consumers are increasingly relying on reduced savings and selective spending adjustments to maintain consumption levels. Evidence of this adjustment is already visible in weaker discretionary services spending and in goods categories where higher prices appear to be dampening volumes. Taken together, the data suggest that while consumer spending has held up in nominal terms, underlying real demand is softening, leaving consumption increasingly vulnerable to further increases in energy prices and broader cost pressures.
Recent data on business investment and production suggest that underlying industrial momentum was solid heading into the Iran conflict, though near-term readings have been distorted by sector-specific swings and early supply disruptions. February’s durable goods report showed a headline decline of 1.4 percent driven largely by a sharp drop in aircraft orders, but underlying demand was firm, with orders excluding transportation rising 0.8 percent and broad-based gains across primary metals, machinery, and motor vehicles. Core capital goods orders and shipments — key indicators of equipment investment — both strengthened, pointing to a healthy pace of business spending prior to the escalation in geopolitical tensions. By contrast, March industrial production fell 0.5 percent, reflecting a combination of payback from strong February revisions, weaker vehicle output, declining utilities production, and emerging supply-chain constraints tied to the conflict. Manufacturing output edged lower despite prior signs of strength in survey data, while capacity utilization slipped modestly. Taken together, the data suggest that the investment cycle entered the current period on relatively firm footing, but faces a more uncertain outlook as defense-related demand and supply disruptions offset potentially softer private-sector activity amid rising costs and heightened uncertainty.
Pulling back to a wider view, recent macro data suggest the U.S. economy entered 2026 with firmer underlying momentum than headline figures imply, even as the current environment has become more uncertain. Fourth-quarter GDP was revised down to a modest 0.5 percent growth rate, but income-based measures point to stronger activity, with real gross domestic income rising 2.6 percent and corporate profits posting robust gains. Much of this divergence reflects technical distortions tied to last fall’s government shutdown, which depressed measured output while leaving underlying income and demand comparatively intact; real final sales to private domestic purchasers still advanced a solid 1.8 percent. This stronger foundation is broadly consistent with the Federal Reserve’s latest Beige Book, which describes continued, if modest, expansion across most regions through early April, with consumer spending holding up and manufacturing activity generally improving. At the same time, the report highlights a shift in tone, with firms increasingly citing geopolitical tensions and rising costs as sources of uncertainty, leading many to adopt a more cautious, wait-and-see approach to hiring, pricing, and investment decisions.
Against that backdrop, the policy outlook has tilted more cautious and incrementally hawkish, with the Federal Reserve signaling a clear preference to remain on hold amid heightened uncertainty and persistent inflation risks. Minutes from the March FOMC meeting indicate that while officials still see a path to eventual rate cuts, that timing has been pushed further out, with greater concern that inflation may prove more durable — even raising the possibility of additional tightening if price pressures fail to ease. At the same time, policymakers recognize a two-sided risk environment, in which the same oil-driven shock that lifts inflation could ultimately weigh on employment and growth, reinforcing a data-dependent and “nimble” approach. Near-term data are expected to show continued firm activity alongside elevated cost pressures, though the partial easing in oil prices following the early-April ceasefire may help reduce immediate risks to both inflation and growth. Fiscal factors are also providing some near-term support to demand, with tax refunds helping to sustain consumption despite rising energy costs. Overall, the policy stance reflects a balancing act: holding steady in the face of competing risks, while deferring any easing until clearer evidence emerges that inflation is durably moving back toward target.
Stepping back, the broader picture is one of an economy that remains fundamentally intact and, in several respects, more resilient than headline volatility might suggest. Growth entered 2026 on solid footing, inflation — while temporarily elevated by energy — remains contained beneath the surface, and both labor markets and business activity continue to expand, albeit at a more measured pace. At the same time, the composition of recent data reveals a system under pressure rather than in decline: real consumption is softening, hiring is becoming more selective, and firms are navigating rising input costs and supply disruptions with caution rather than retrenchment. The outlook, therefore, is cautiously constructive — supported by stable income growth, still-positive demand, and the likelihood that current inflation shocks will fade — but increasingly clouded by policy ambiguity, lingering tariff risks, and the unpredictable path of the Iran conflict. These crosscurrents leave the economy in a delicate but not unfavorable position: resilient in the present, but with confidence and momentum vulnerable to further shocks or missteps in policy.
LEADING INDICATORS
ROUGHLY COINCIDENT INDICATORS
LAGGING INDICATORS
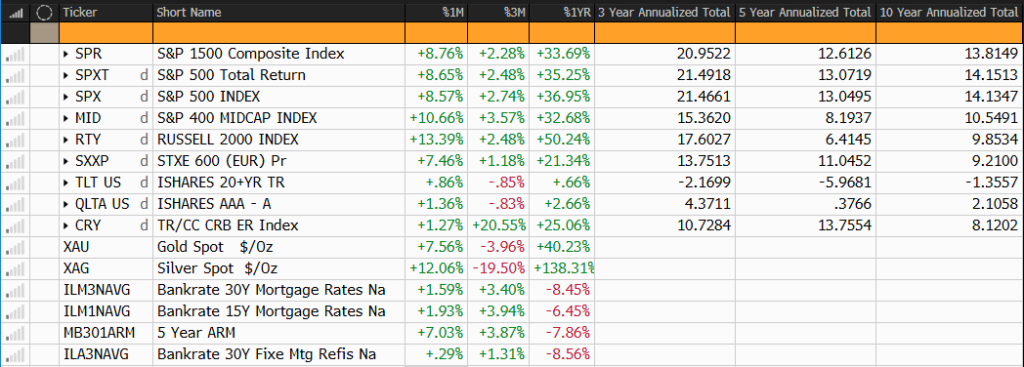
CAPITAL MARKETS PERFORMANCE